Call Center Performance
تفاصيل العمل
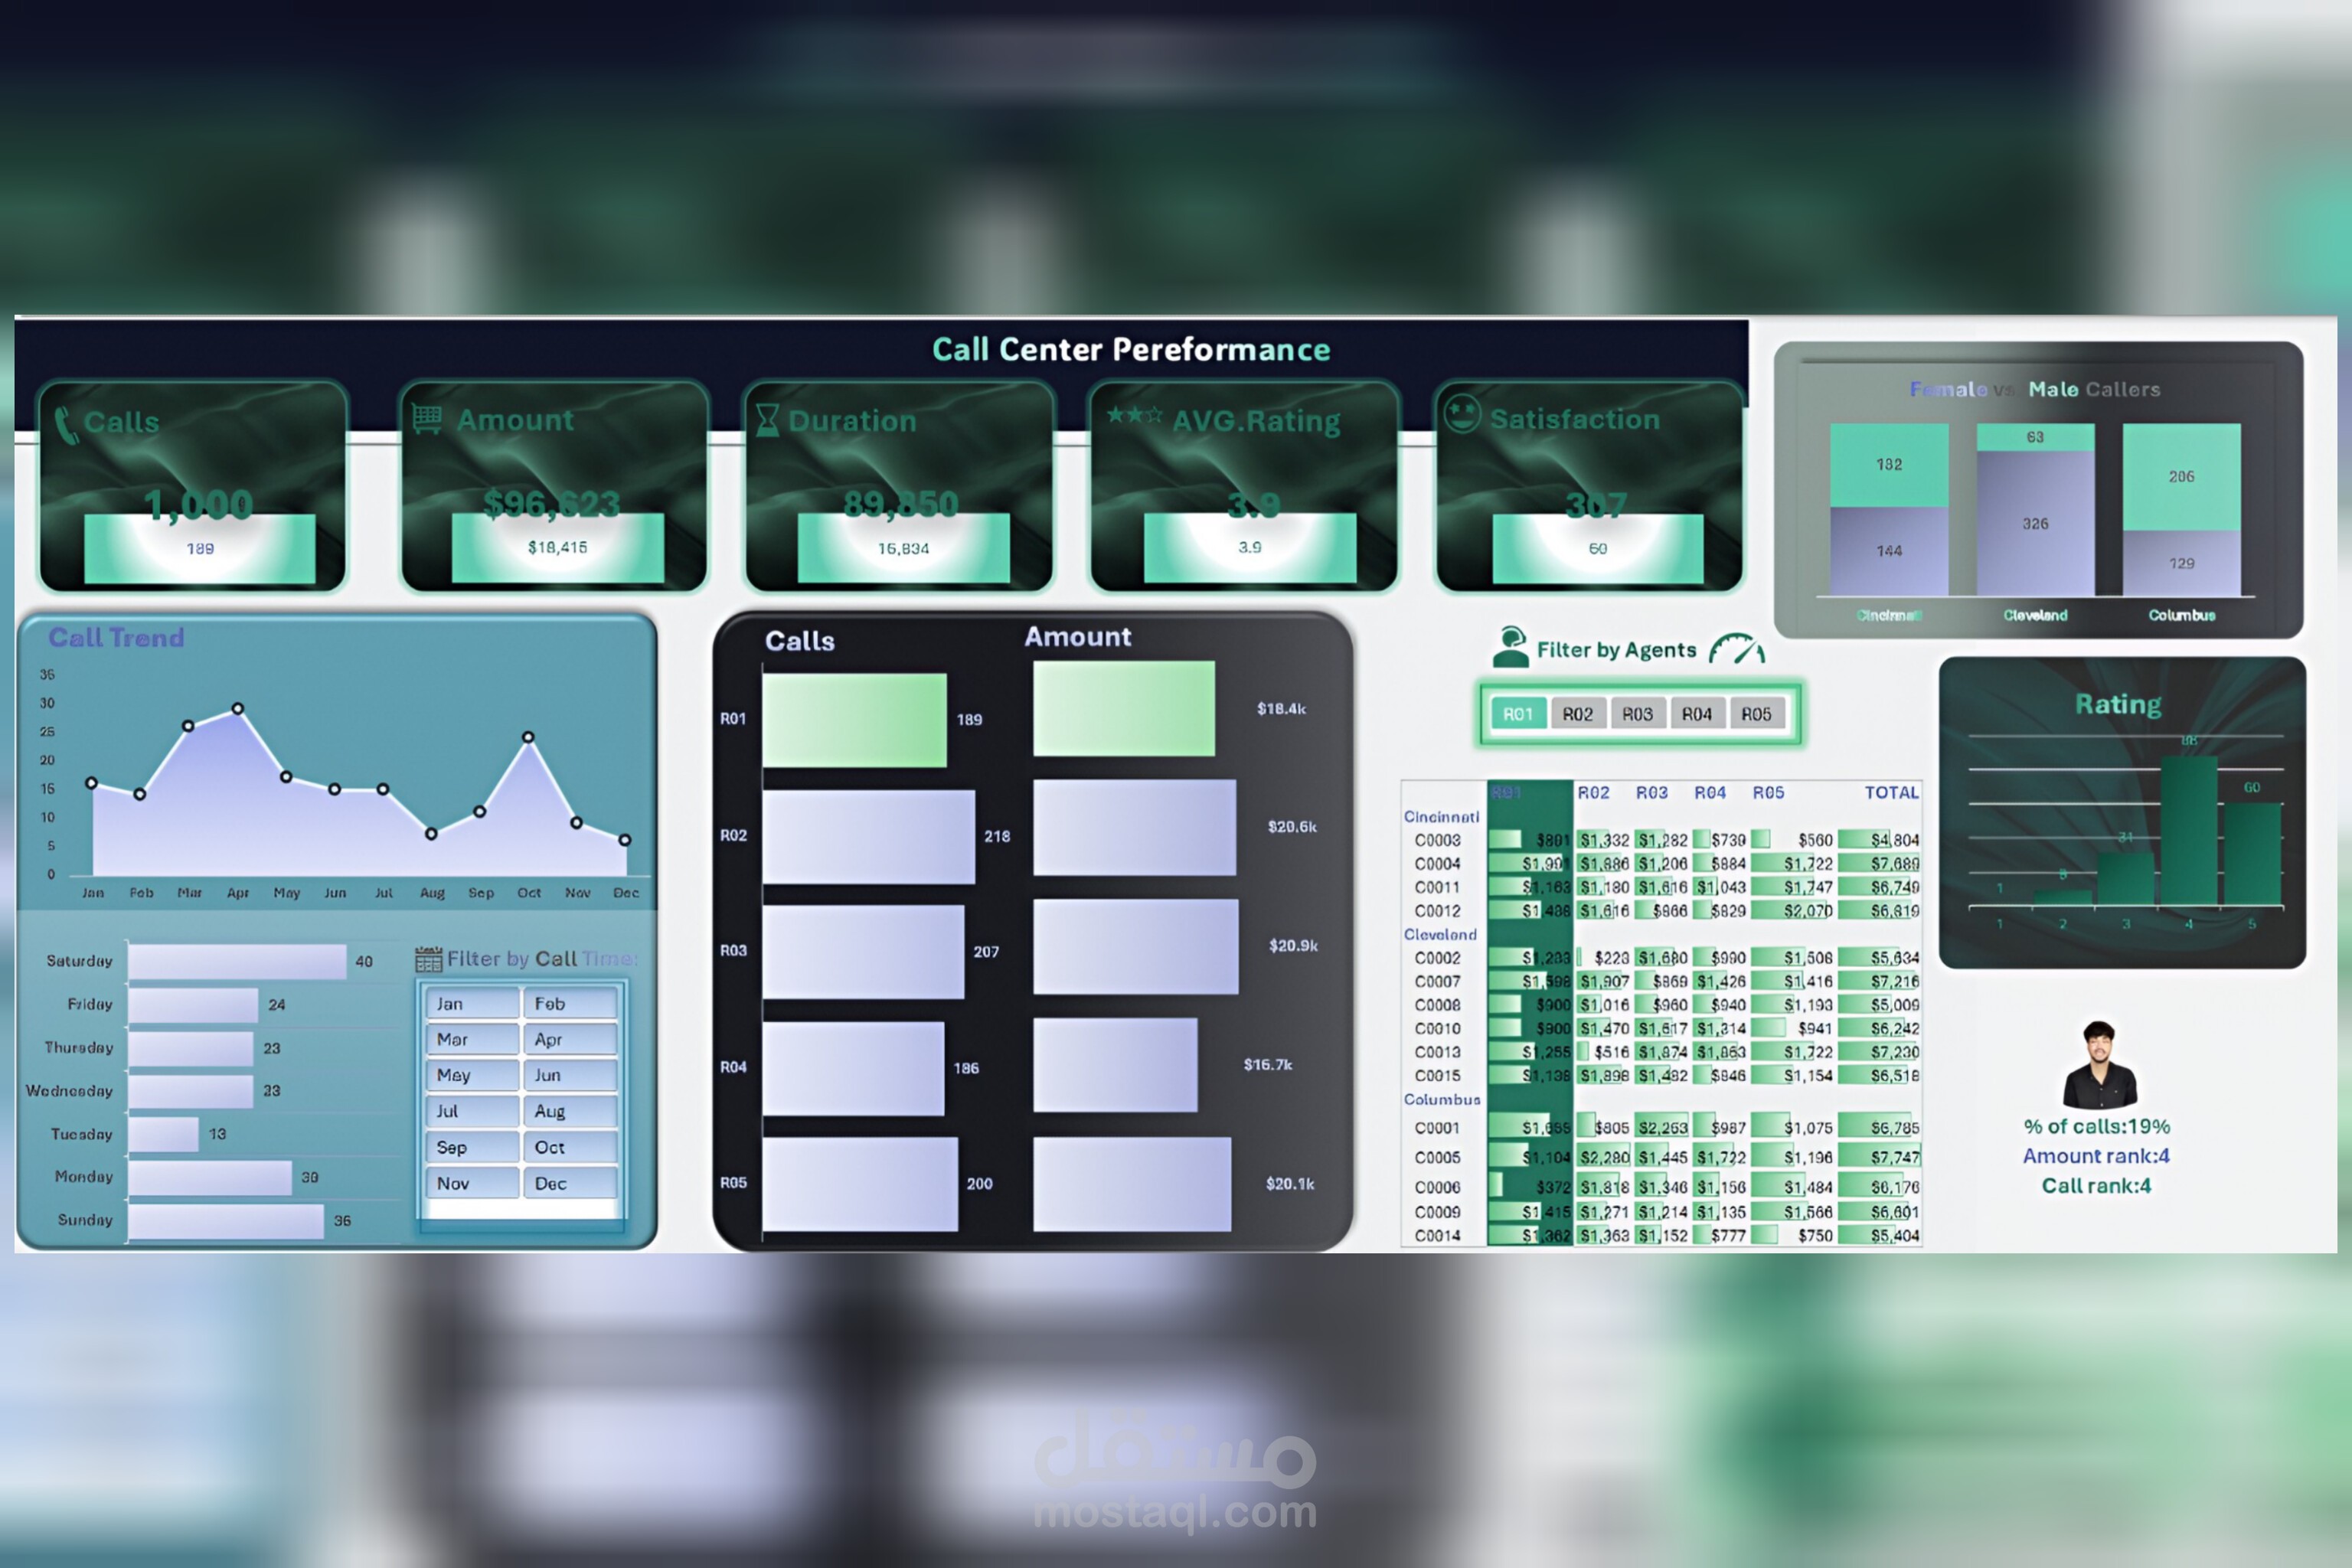
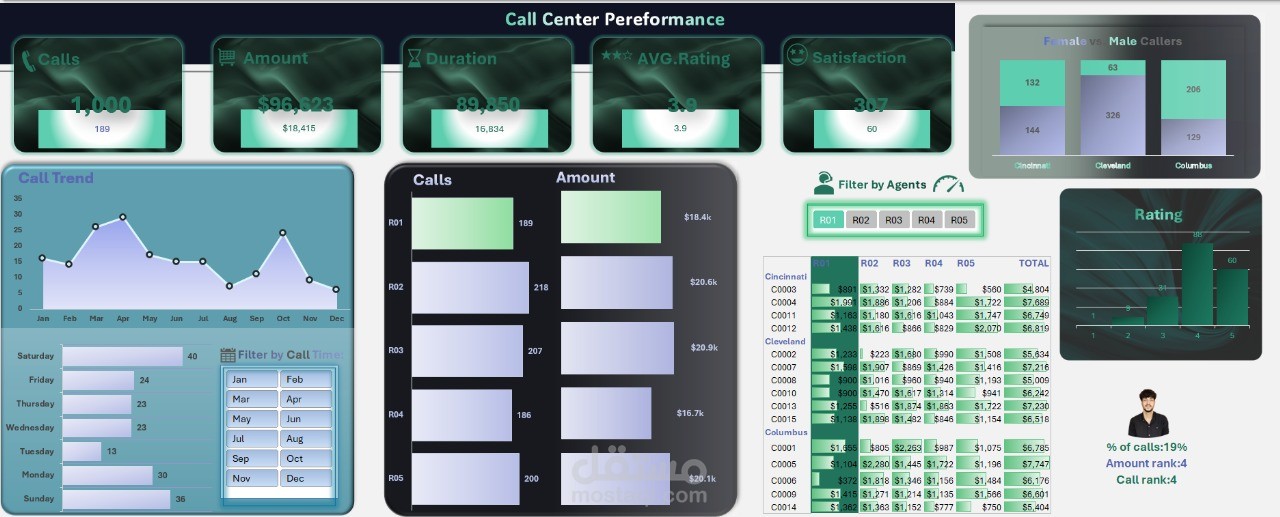
Turning raw call data into actionable insights helps:
Measure productivity
Improve customer satisfaction
Support data-driven decisions
I created an interactive dashboard to analyze and monitor call center performance using Excel.
Here are the main KPIs I tracked:
Calls: 1,000
Revenue: $96,623
⏱ Duration: 89,850 mins
⭐ Avg. Rating: 3.9
Satisfaction: 30.7%
What the dashboard shows:
Call trends by month & weekday ⏳
Female vs Male callers across cities
Agent performance analysis → filter by agent (R01–R05) to track calls, revenue & ratings
Dynamic rating section (bottom-right) → changes instantly based on the selected agent
Interactive filters by time, location, and agent