Excel dashboard
تفاصيل العمل
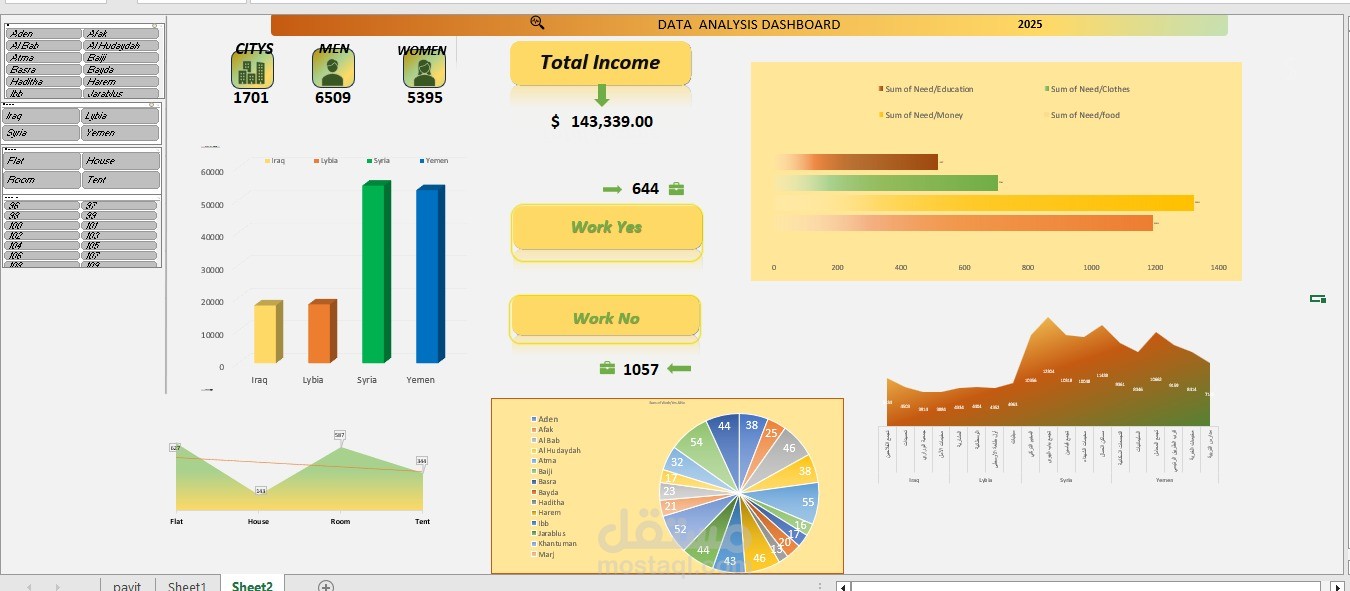
This dashboard shows data about refugees for 2025, focusing on income and needs. Here’s a quick breakdown:
Top Section:
Title: "DATA ANALYSIS DASHBOARD 2025"
Counts: 1701 cities, 6509 men, 5395 women
Total Income: $143,339.00
Charts:
Bar Chart: Shows data for Iraq, Libya, Syria, and Yemen, with Syria and Yemen having the most.
Buttons: "Work Yes" (644 people) and "Work No" (1057 people), showing who has jobs.
Bar Chart: Compares needs like clothes, education, money, and food, with food being the highest need.
Line Chart: Tracks "Flat," "House," "Room," and "Tent" over time with ups and downs.
Pie Chart: Breaks down data by locations (e.g., Aden, Al-Ahsa).
Area Chart: Shows a trend over time with labels in Arabic for different countries.
Sidebar: Lists cities and housing types (e.g., Flat, House) to filter the data.