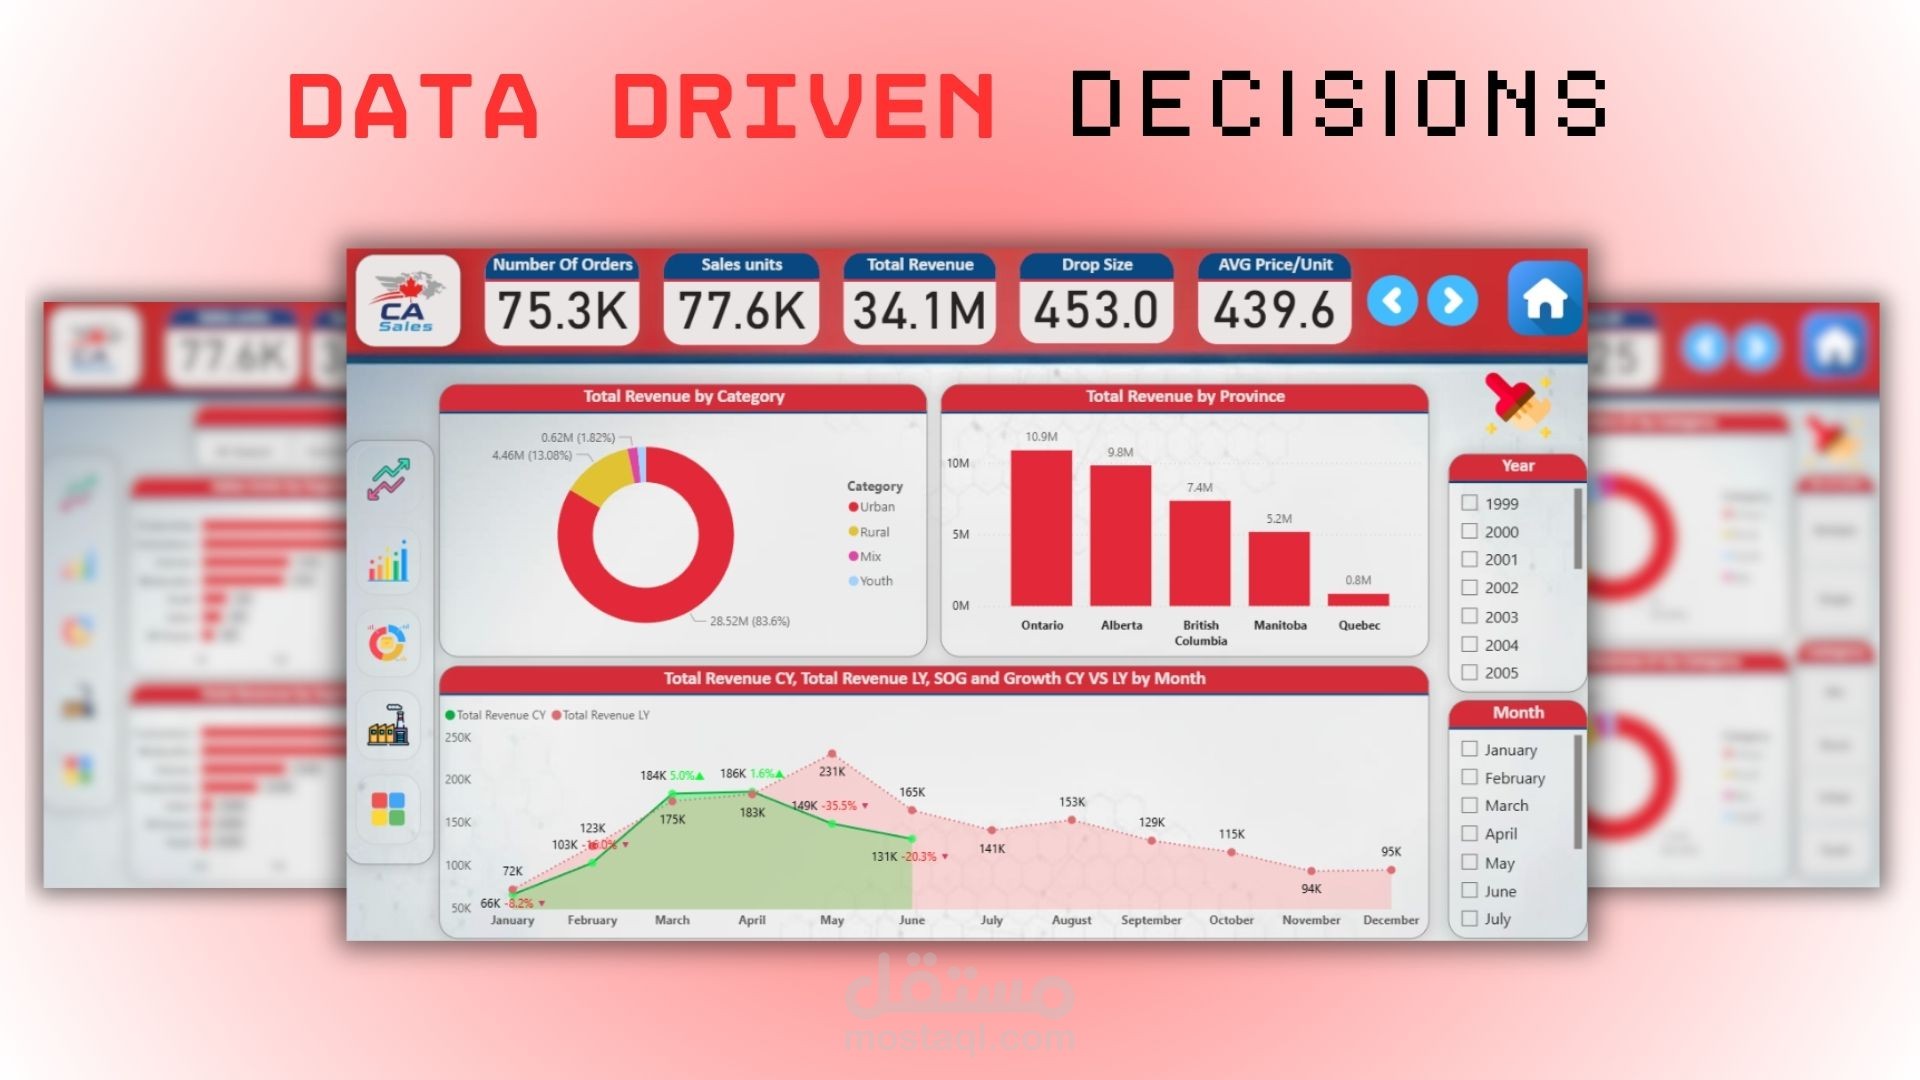
Canada Sales Dashbaord
تفاصيل العمل

1. Navigation Page
This is the central landing page for the "Canada Sales Dashboard." It acts as a user-friendly main menu, providing a clear and branded entry point. From here, users can navigate to five distinct analytical sections: a high-level Main Analysis, a breakdown by product Segment, performance by Manufacturer, an in-depth Category view, and a time-based comparison of the Current Year and Current Month (CY and CM).
2. Main Analysis Page
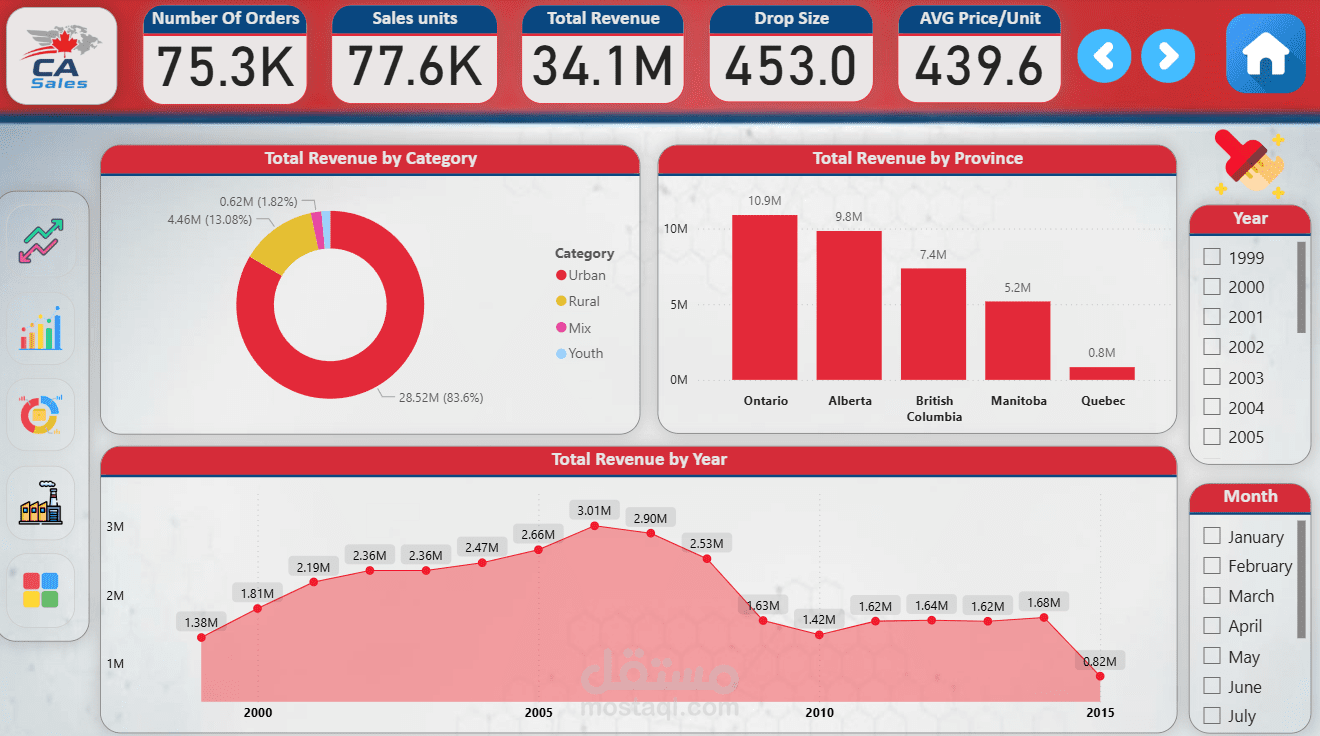
This page serves as the executive summary of the overall business performance. It highlights key performance indicators (KPIs) at the top, including Total Revenue, Number of Orders, and Sales Units. The core of the page provides three essential perspectives:
Revenue by Category: A donut chart showing the "Urban" category as the primary revenue driver.
Revenue by Province: A bar chart identifying top-performing provinces, with Ontario and Alberta leading.
Revenue by Year: An area chart illustrating long-term revenue trends, showing a peak around 2006 followed by a decline and stabilization.
3. CY and CM (Time Analysis) Page
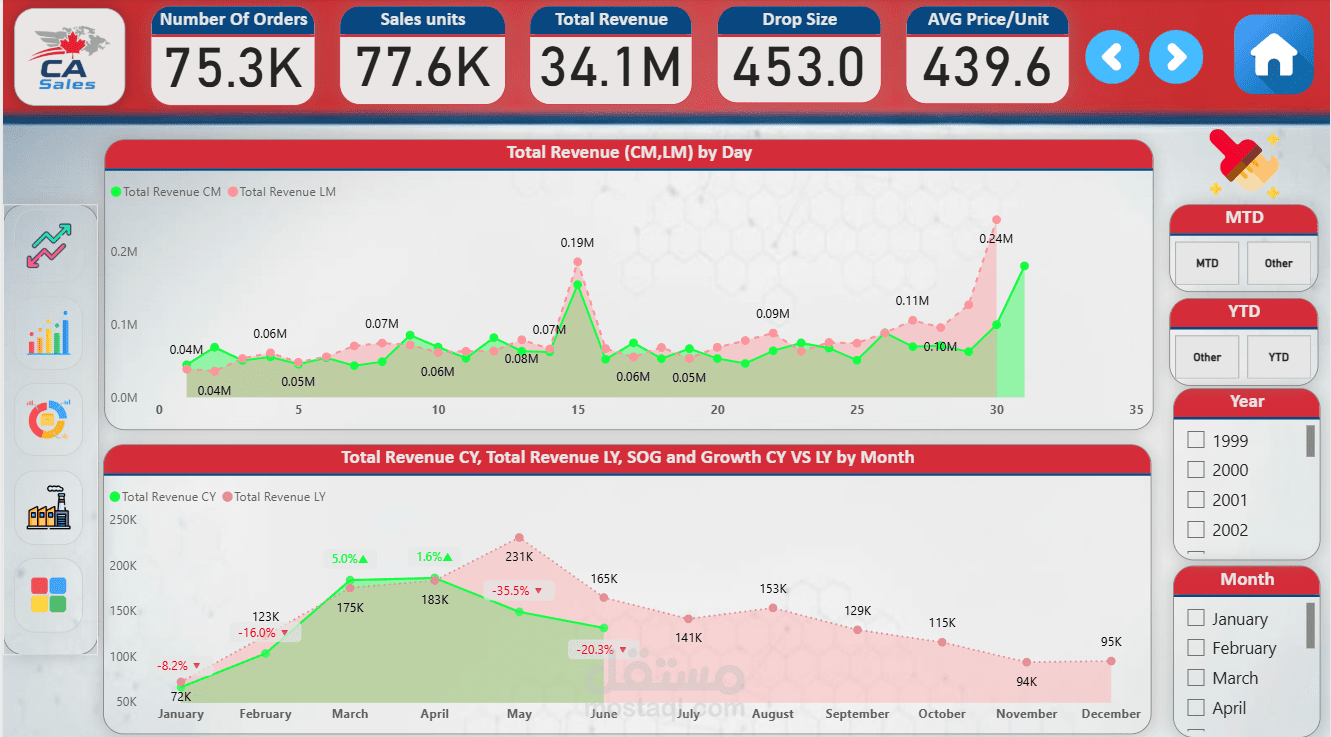
This dashboard is dedicated to time-series analysis, allowing for performance tracking against previous periods.
Total Revenue (CM, LM) by Day: A line chart that provides a granular, day-by-day comparison of the current month's revenue against the last month, ideal for monitoring short-term performance and daily trends.
Total Revenue (CY, LY) by Month: An area chart offering a strategic year-over-year view. It not only compares monthly revenue between the current and last year but also explicitly shows the percentage growth or decline for each month, making it easy to spot seasonal patterns and annual performance shifts.
4. Category Analysis Page
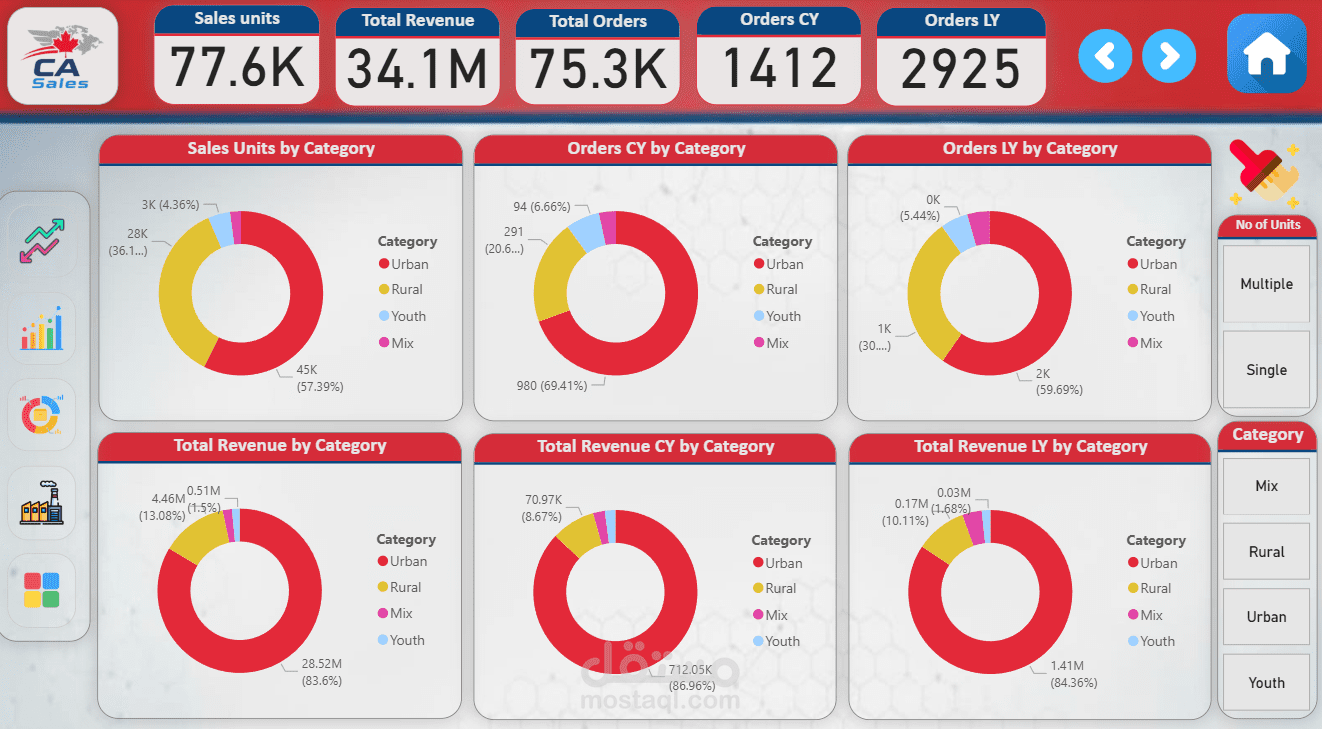
This page offers a detailed breakdown of performance across different customer categories (Urban, Rural, Mix, Youth). Using a series of donut charts, it consistently visualizes the contribution of each category to key metrics like:
Sales Units, Total Revenue, Orders Current Year (CY) vs. Orders Last Year (LY)
The layout allows for a quick and direct comparison, consistently highlighting the "Urban" category's dominance across all measures.
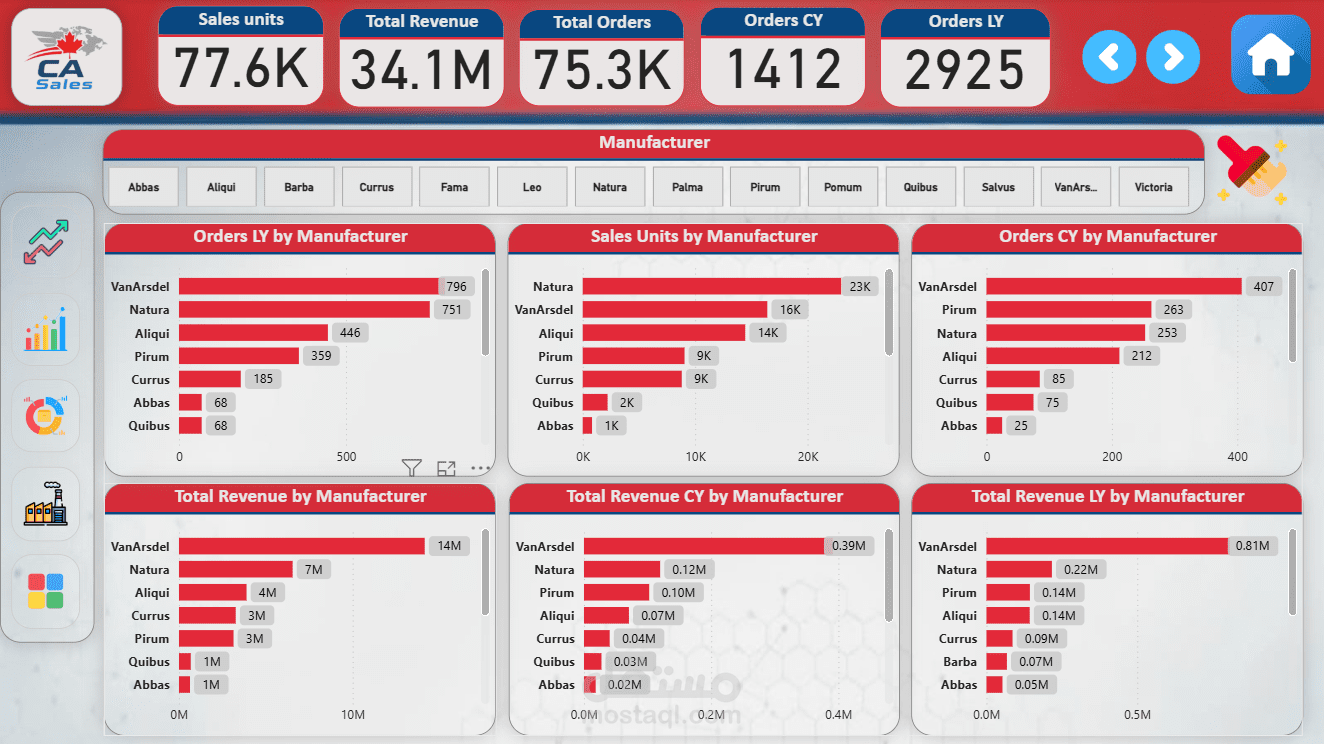
5. Manufacturer Analysis Page
This view focuses on the performance of different manufacturers. Through a set of clear, horizontal bar charts, it ranks manufacturers based on crucial metrics for the total period, the current year, and the last year. This allows for easy identification of top partners like "VanArsdel" and "Natura" in terms of Total Revenue, Sales Units, and Orders. This page is essential for vendor performance reviews, supply chain analysis, and understanding market share among suppliers.
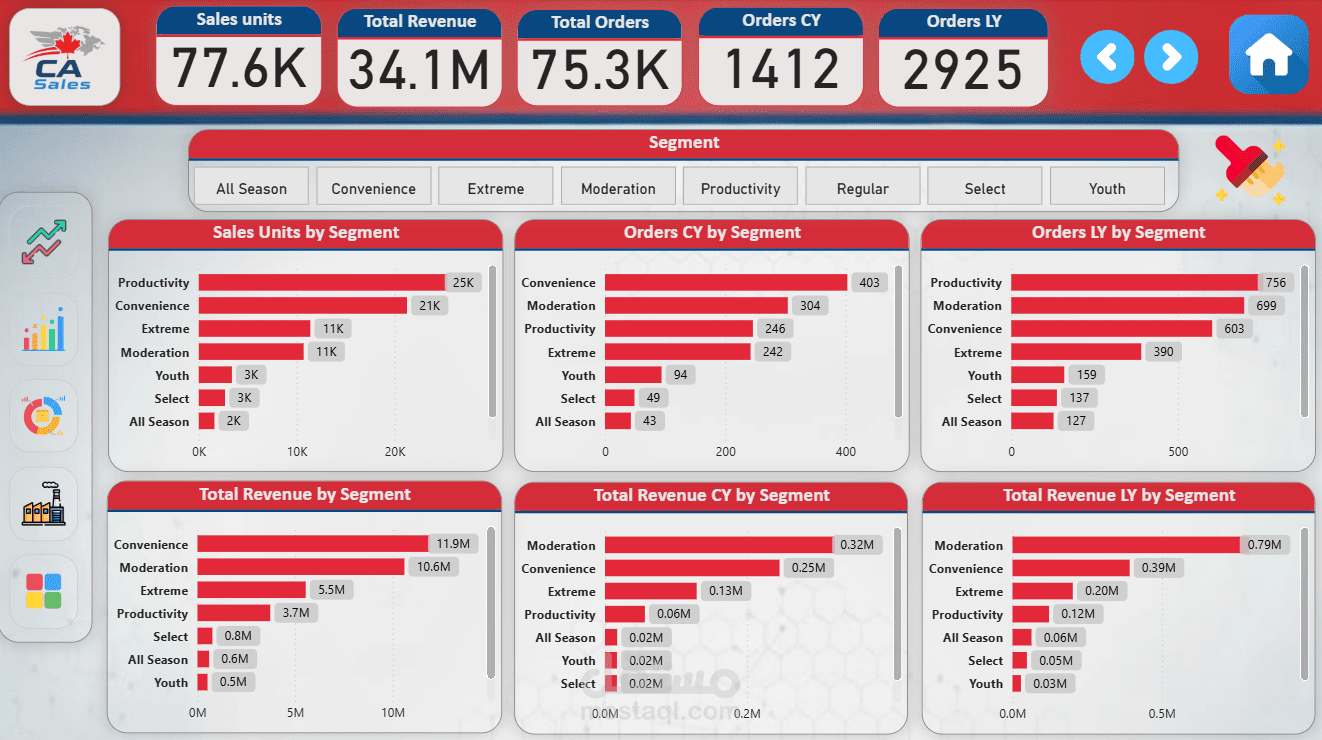
6. Segment Analysis Page
This page breaks down sales data by product segment (e.g., Convenience, Moderation, Productivity). The horizontal bar charts provide a comparative analysis of segments across Total Revenue, Sales Units, and Orders (both CY and LY). This view helps identify which product segments are the most valuable to the business and how their performance has evolved.