BMW Sales with Power BI
تفاصيل العمل

From Excel to Executive Dashboard – BMW Sales with Power BI
في المشروع ده، قدرت أشتغل على تحليل شامل لبيانات مبيعات سيارات
BMW
in this project I used Power BI to go through the full process, from cleaning the data to telling a story through visuals.
What I learned:
Importing and cleaning raw sales data using Power Query
Building solid data relationships with proper Data Modeling
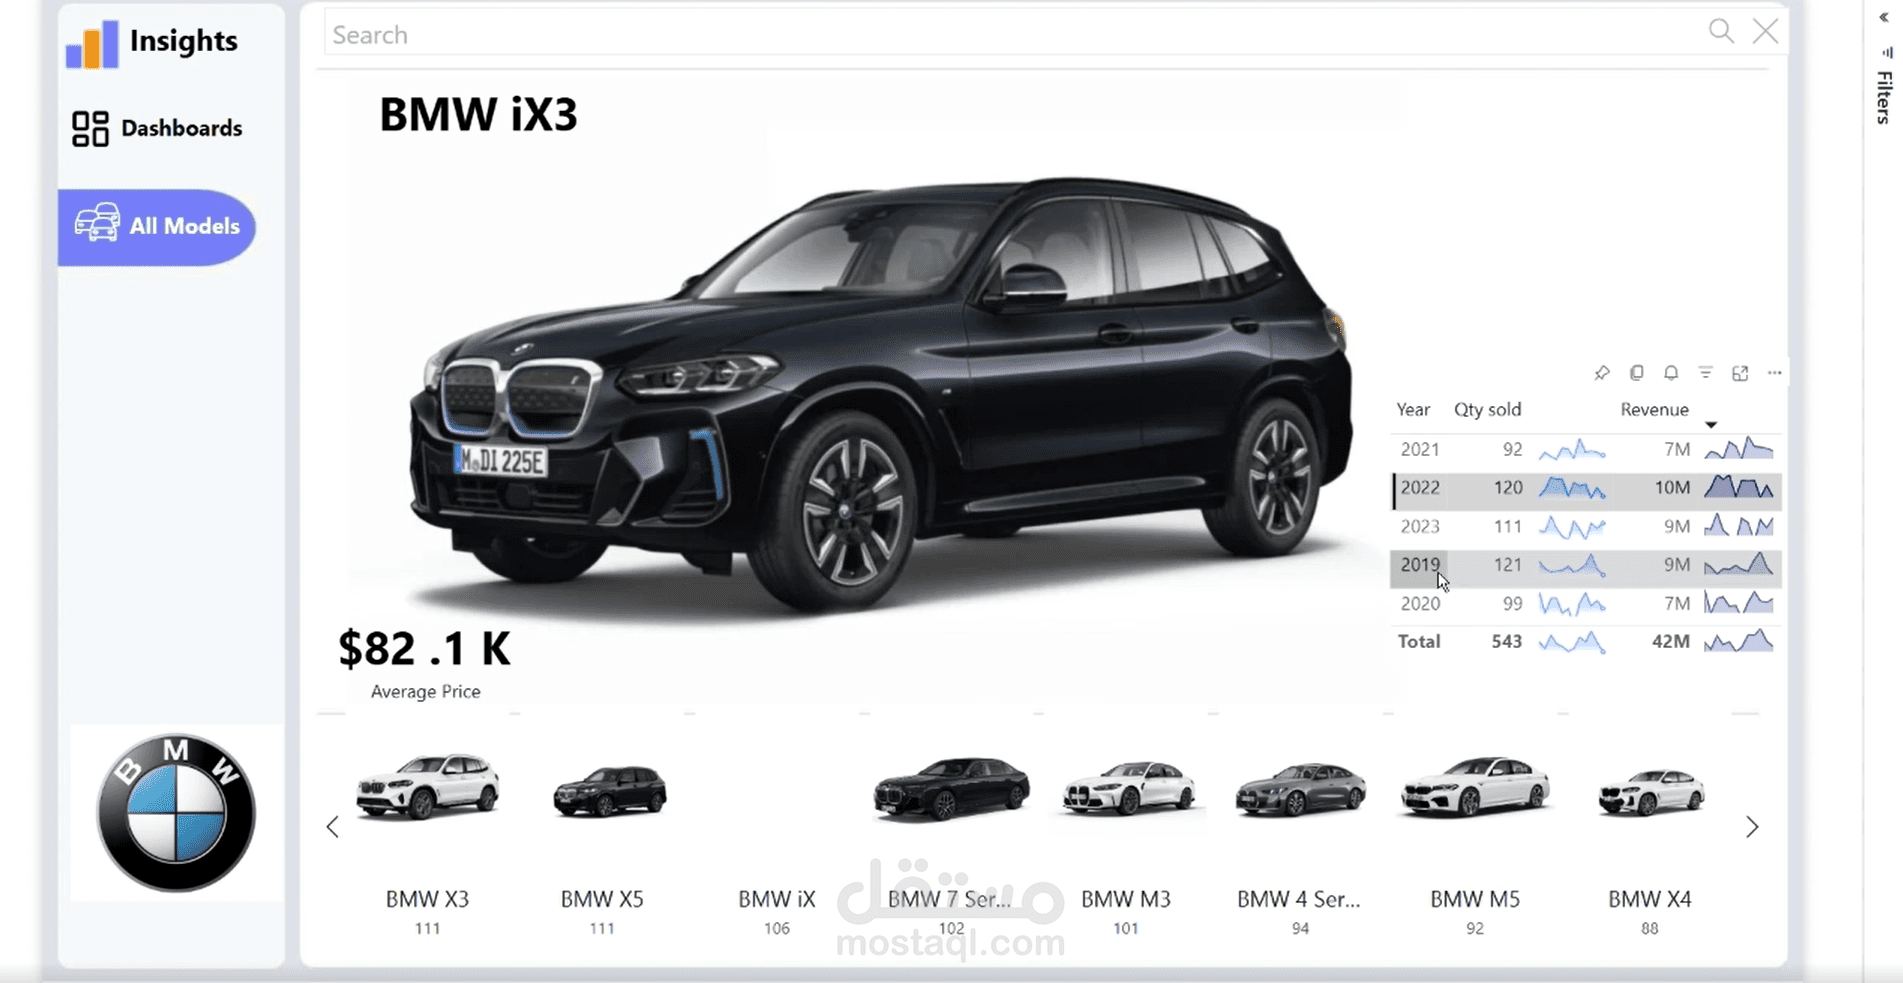
Creating KPIs and dynamic visuals to highlight best-selling models and key trends
Using Bookmarks & Buttons to enhance user interaction
Designing a dashboard that’s clean, focused, and decision-oriented
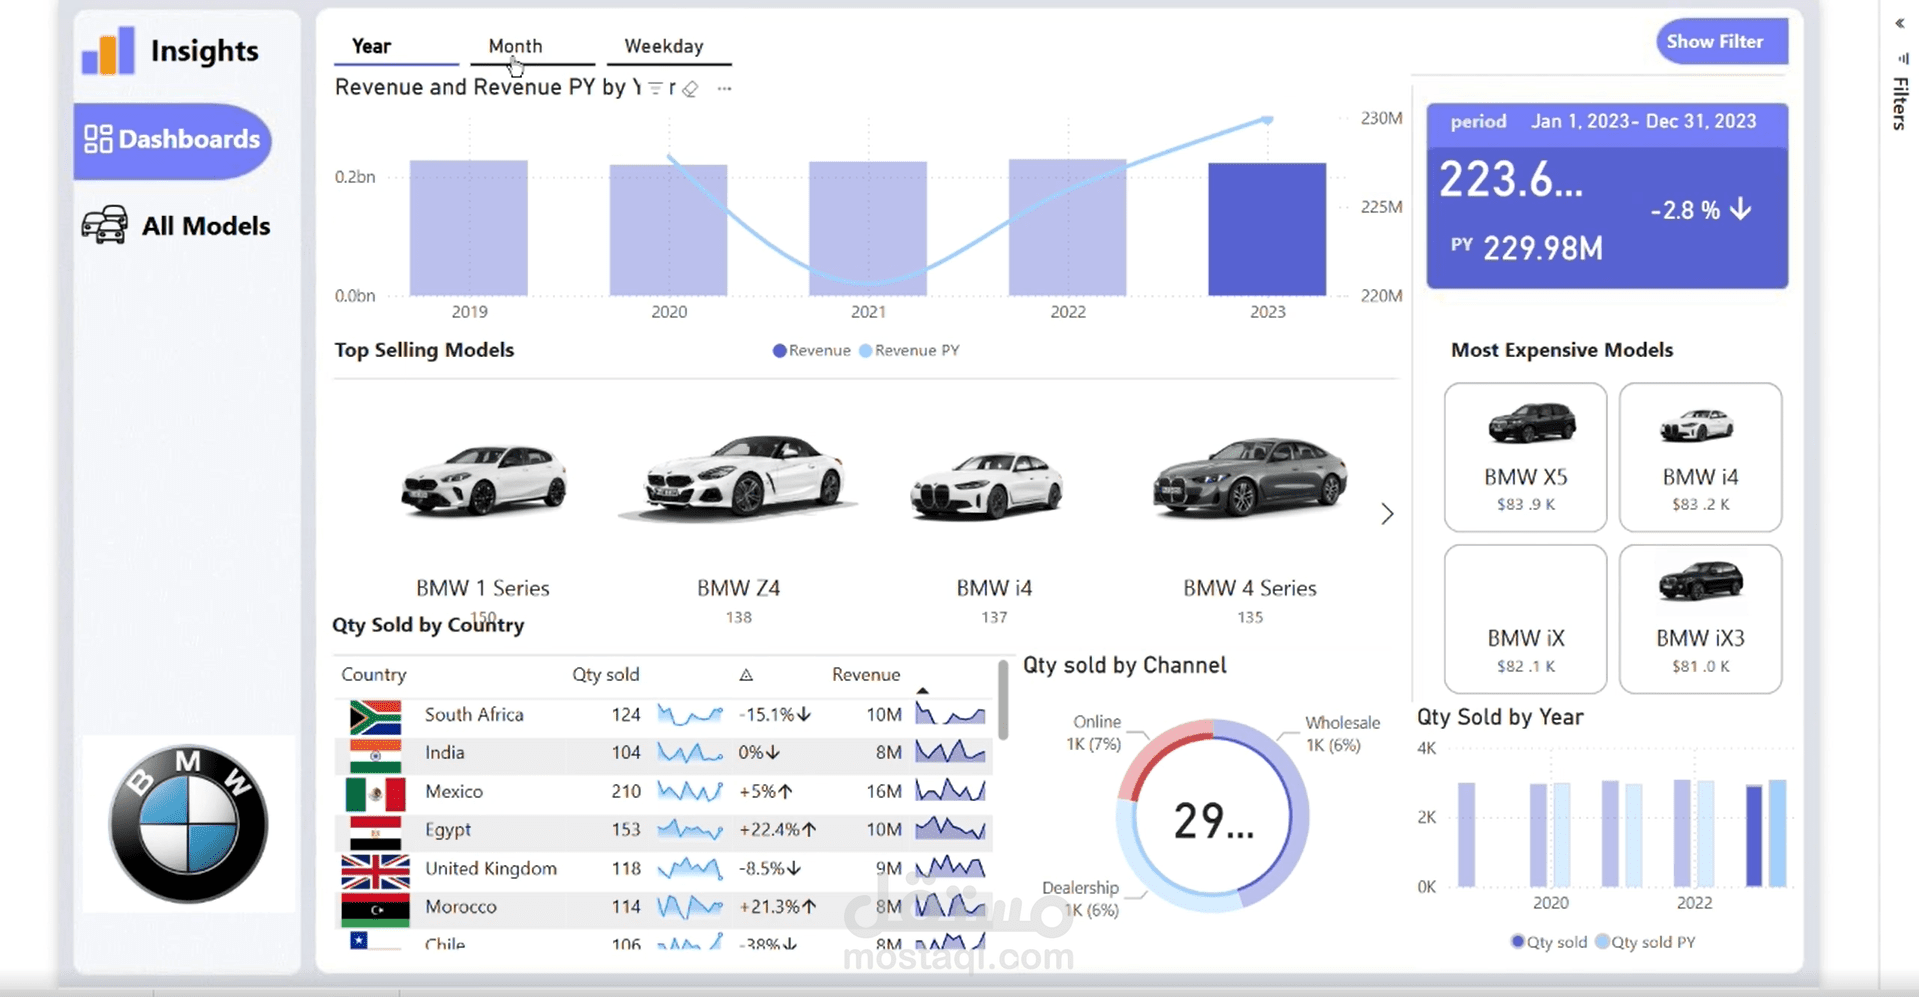
Key Insights from the Dashboard:
BMW Z4 was the top-selling model (666 units)
Mexico led the market with 1,017 units, followed by Nigeria and Egypt
Egypt achieved 639 units with a +31.5% revenue growth
South Korea recorded the highest revenue growth (+32.4%)
The Wholesale channel accounted for 45% of total sales
BMW M8 was the most expensive model sold ($79.1K)
Total revenue from 2019–2023 reached $1.13B with +24.7% YoY growth
? Decisions You Can Make Based on the Data:
Focus marketing efforts on high-performing models like Z4 & 8 Series
Invest more in top-performing countries (Mexico, Egypt, South Korea)
Strengthen Wholesale partnerships — it’s the most impactful channel
Improve Online sales strategies in countries with low digital performance
Review pricing strategy for premium models (like M8 & iX3)
Offer localized promotions based on region-specific trends
Use the positive revenue trend to support next-year planning
This project proved to me that Power BI isn’t just for visuals — it’s a business decision-making tool driven by clean data and strong analysis.
From raw data to clear strategy — I now feel more confident in turning insights into real impact.
If you'd like to check the dashboard or want tips on building something similar, feel free to reach out