Ecommerce dashboard
تفاصيل العمل
You know that feeling when a massive dataset finally clicks and the story it's been hiding becomes crystal clear? I just had one of those moments while building this comprehensive e-commerce dashboard.
It's amazing how much you can learn when you connect all the data points. I'll walk you through the dashboards and some of the key insights:
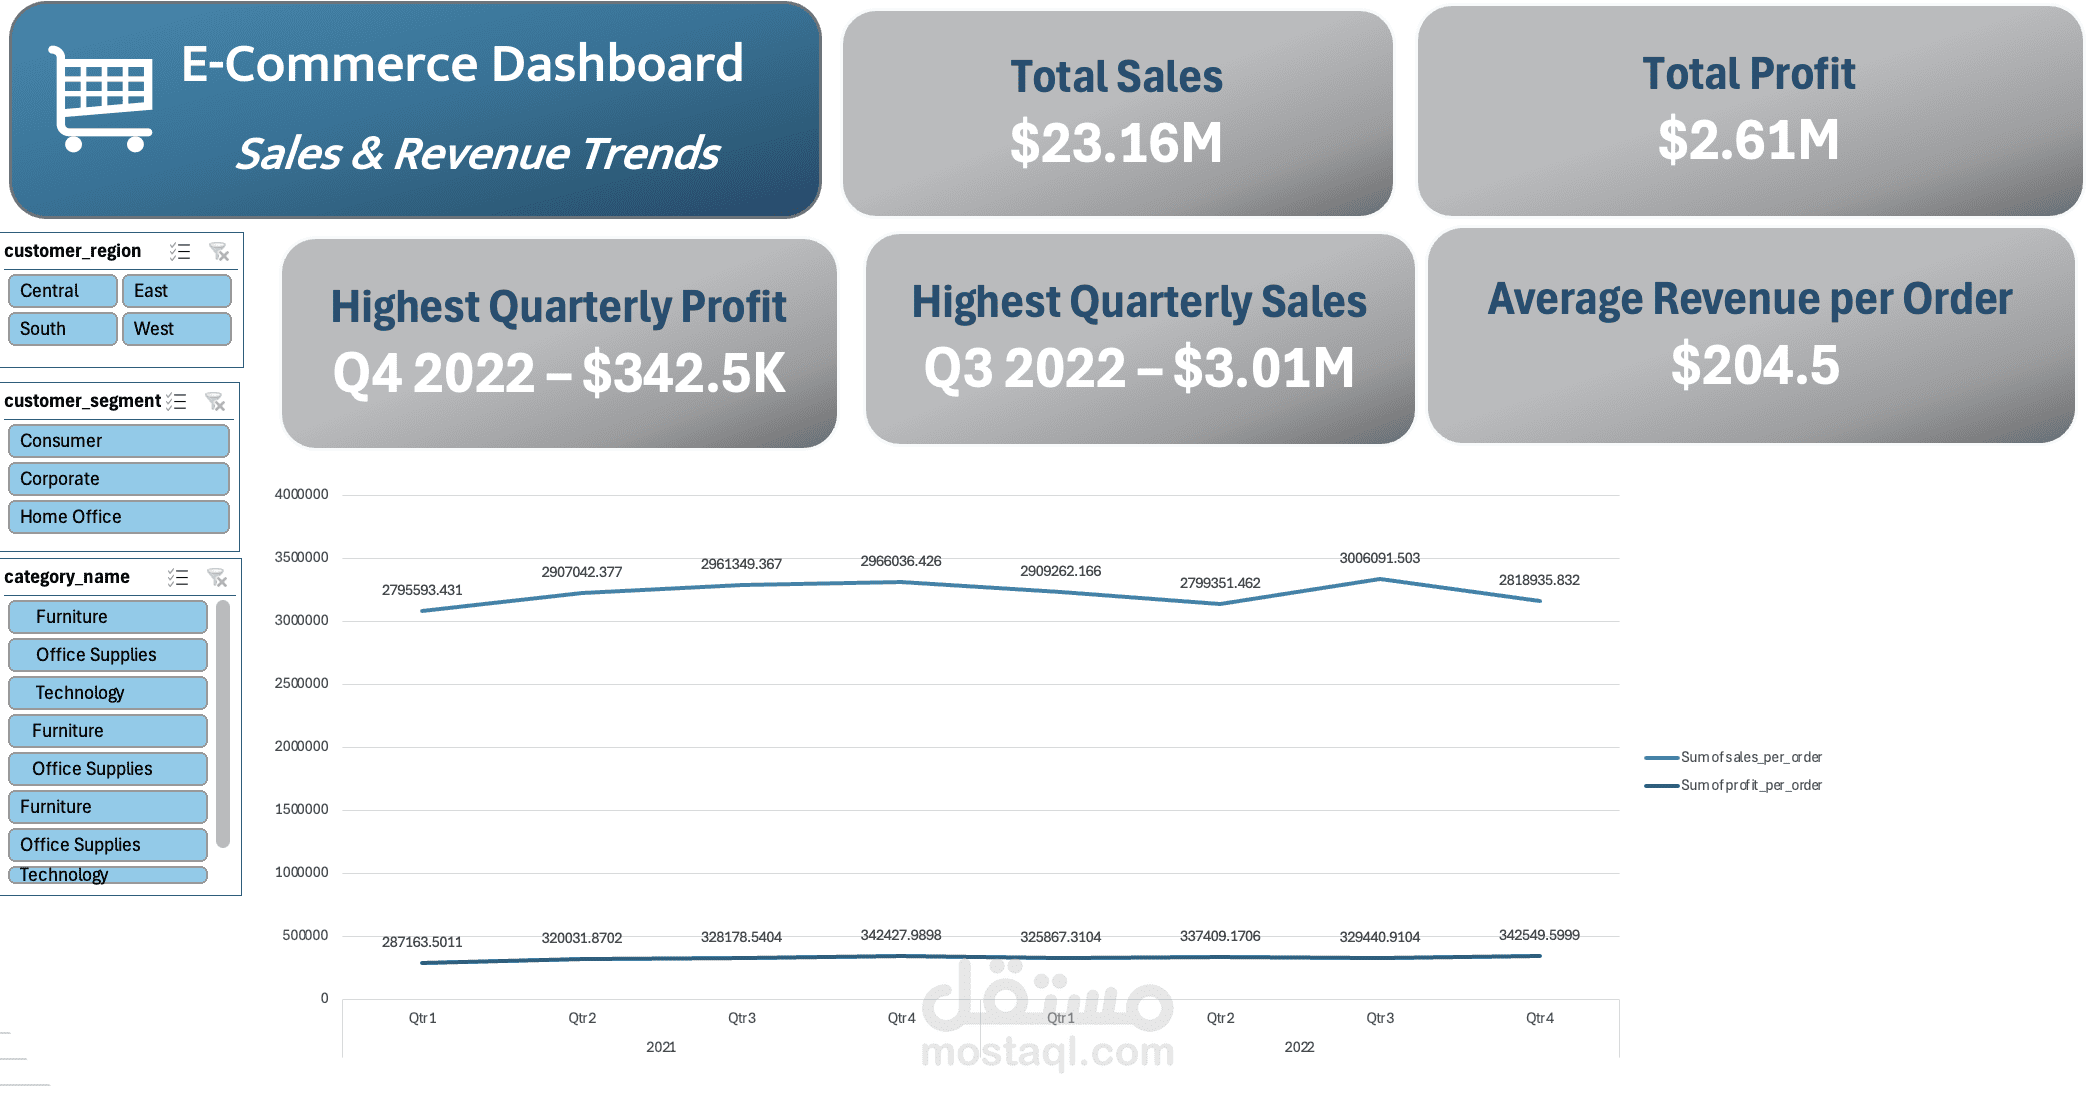
- Sales & Revenue Trends: We had a strong year with $23.16M in sales, but the data showed our most profitable quarter was actually Q4 2022, even though Q3 2022 had the highest sales volume.
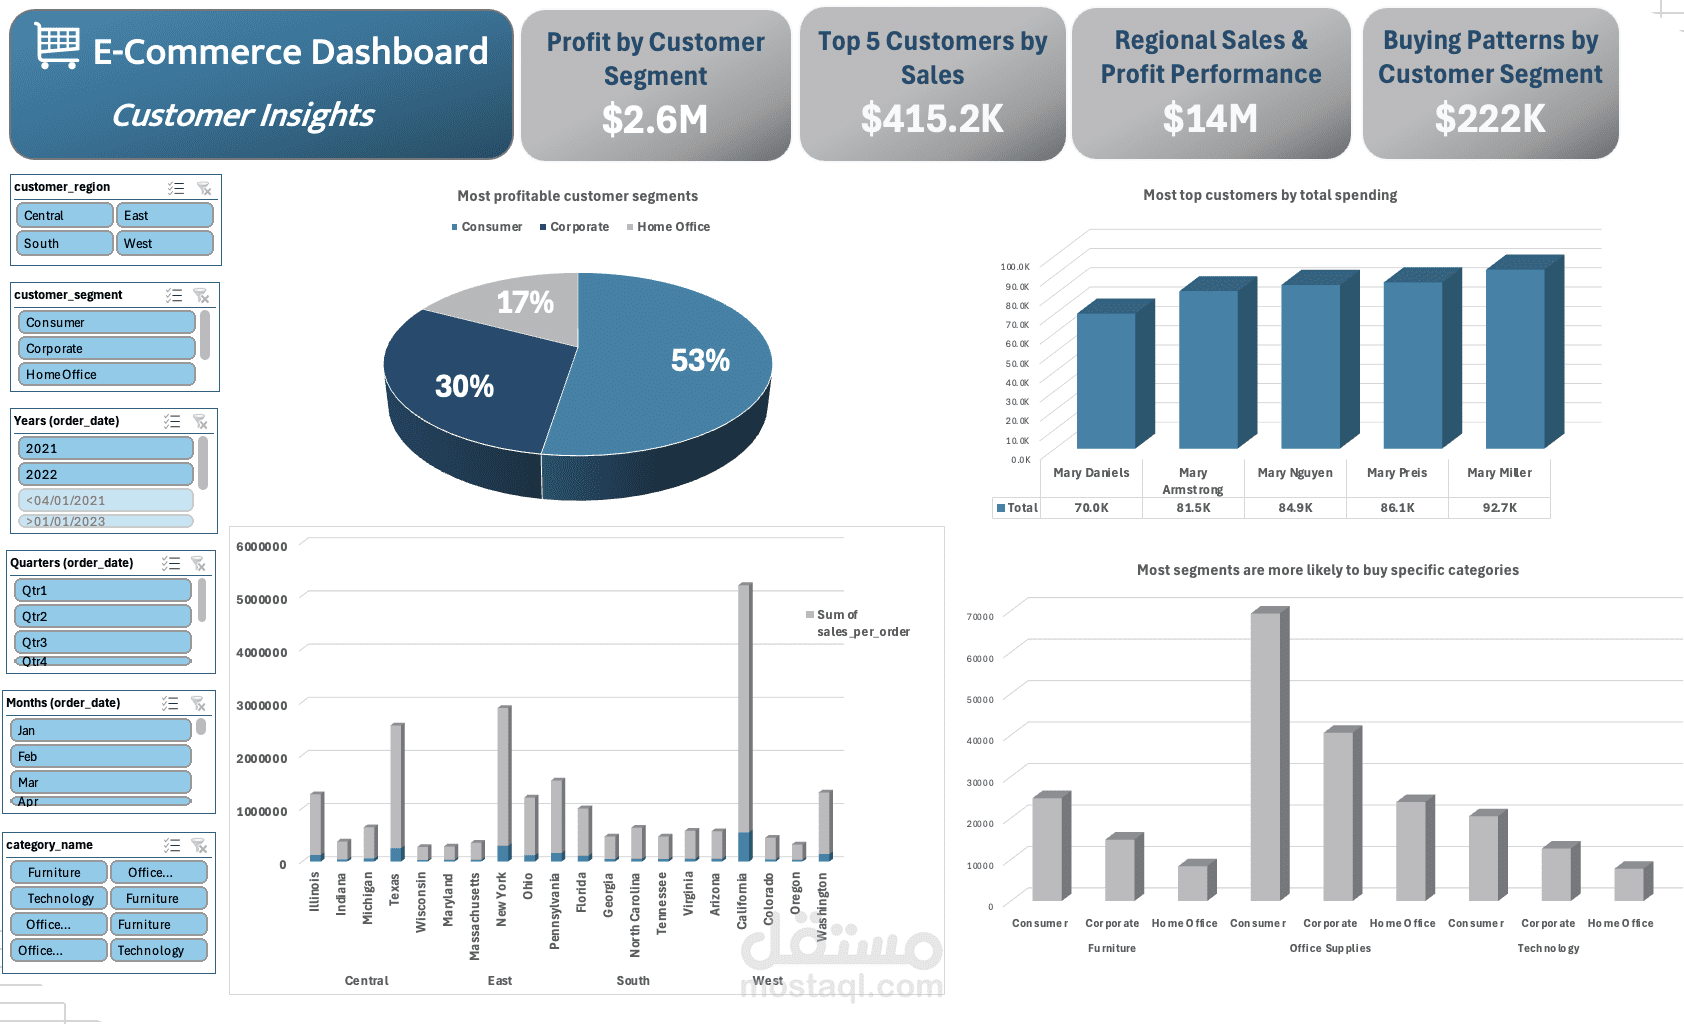
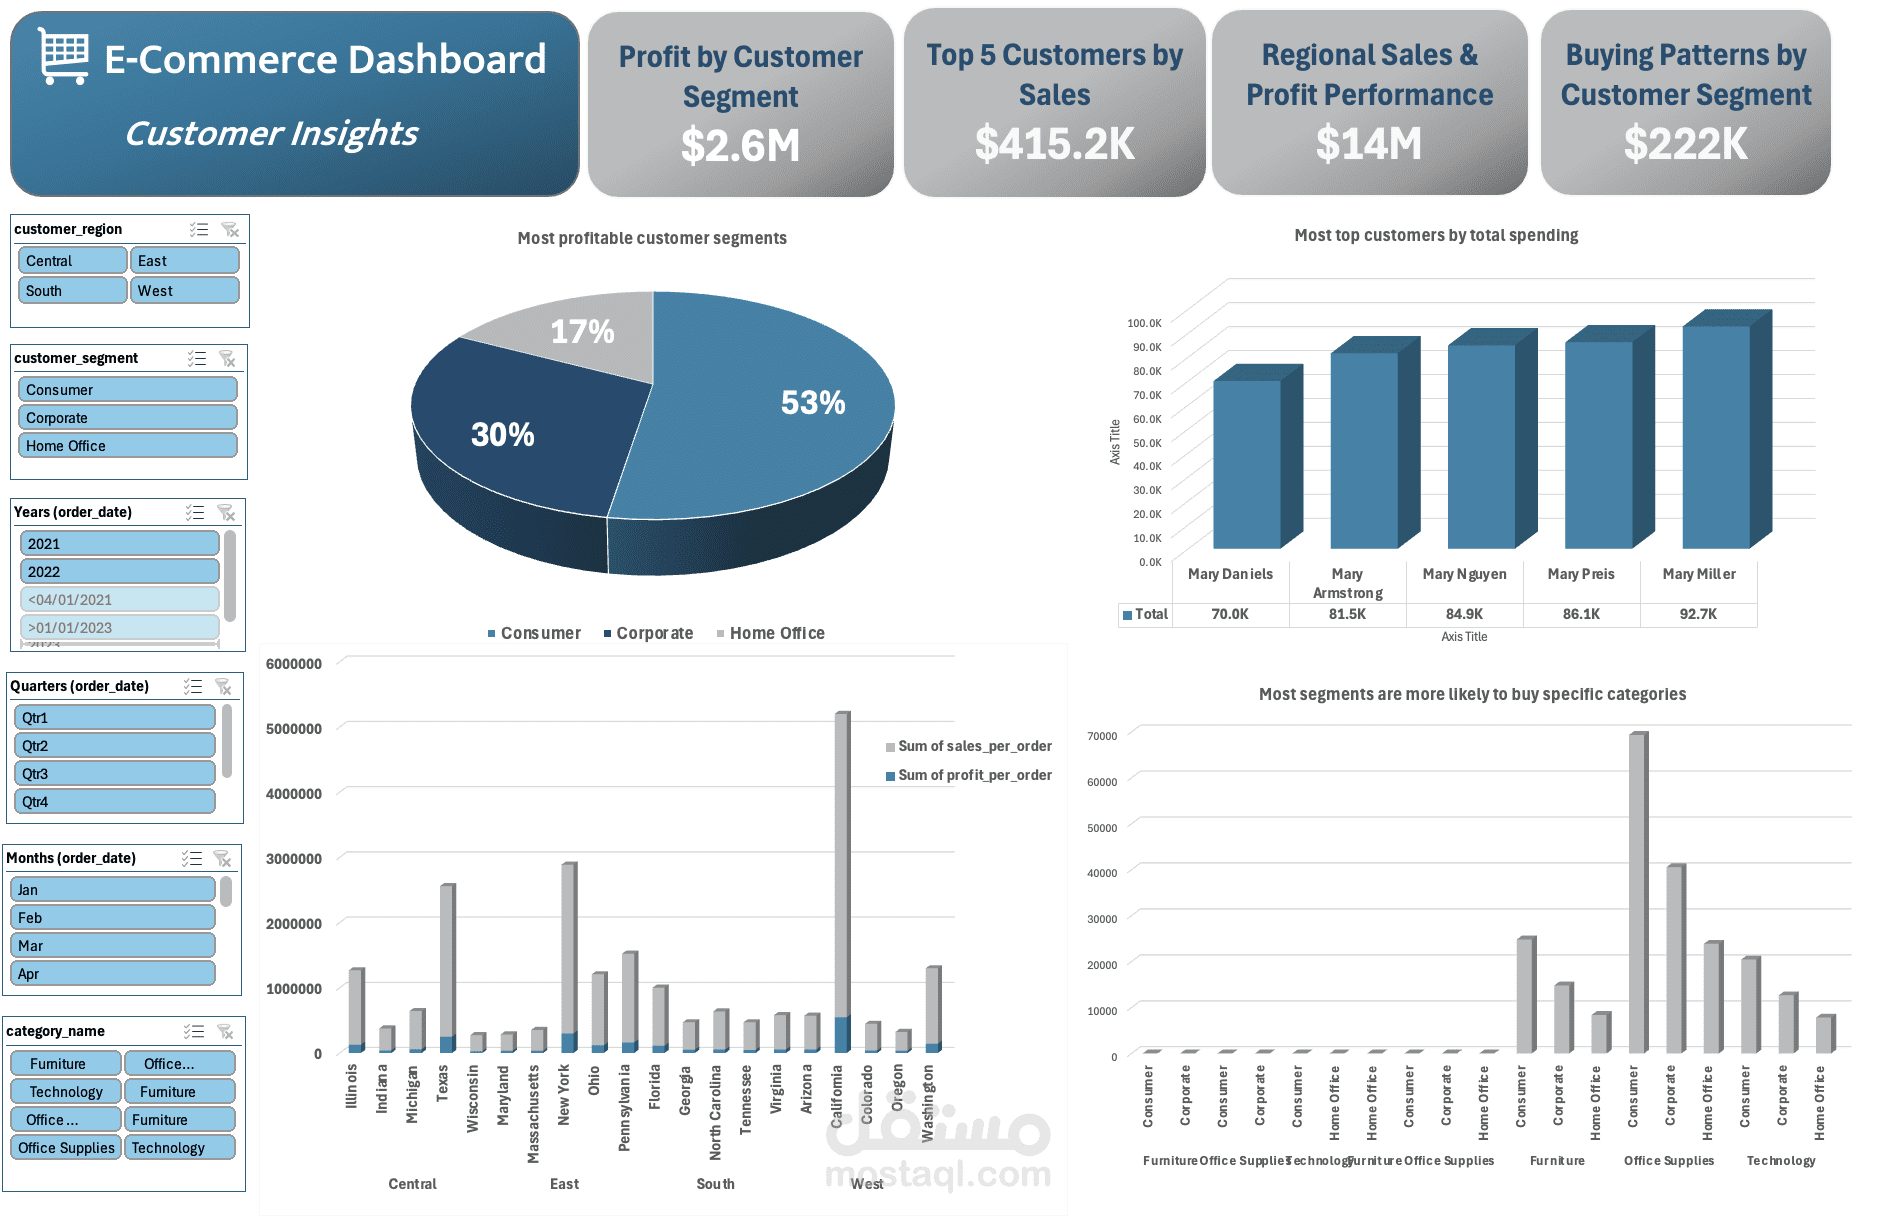
- Customer Insights: Our most profitable segment is the Consumer segment, which contributed 53% of our total profit. This dashboard also revealed that our top customers drove a combined $415.2K in sales.
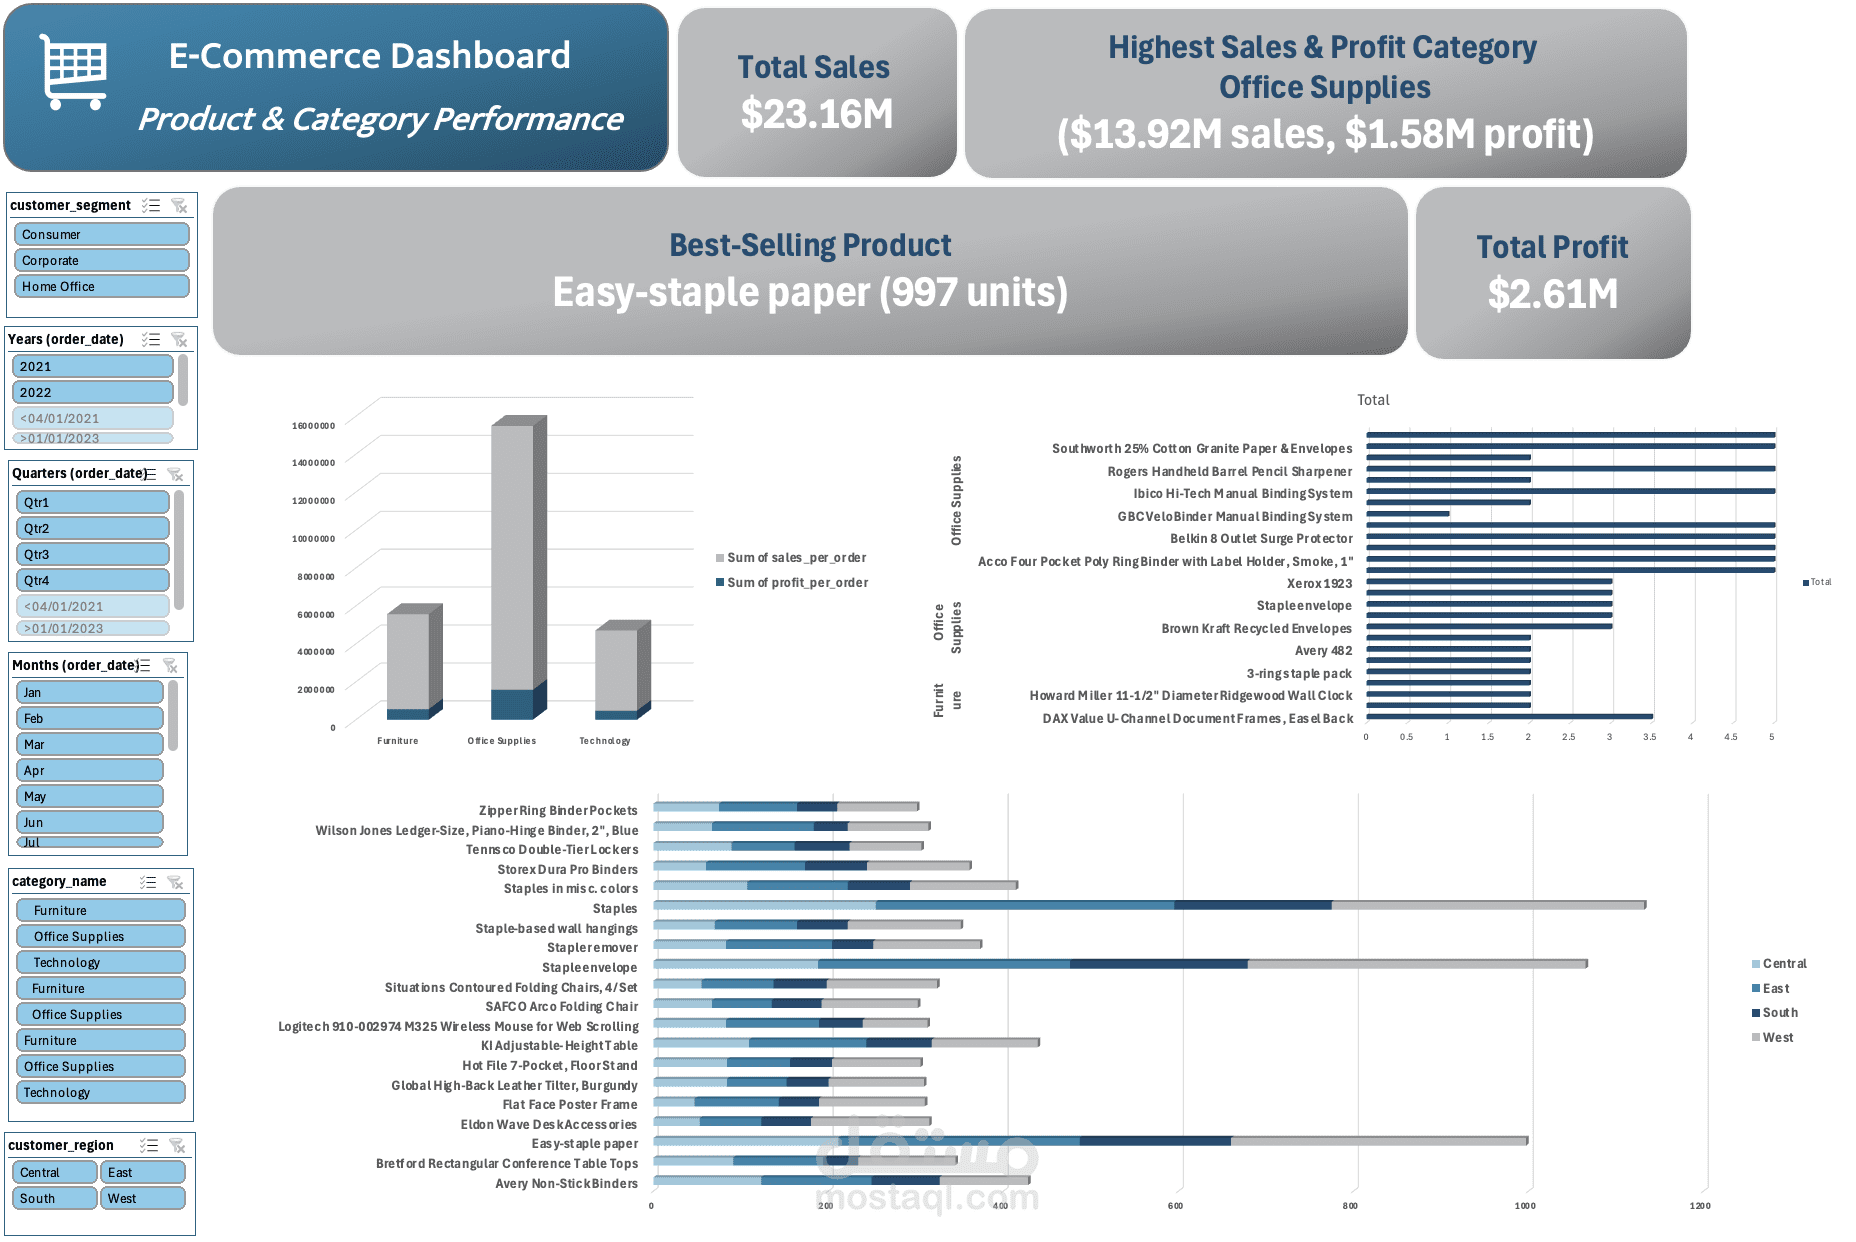
- Product & Category Performance: The Office Supplies category is our clear top performer, generating $1.58Min profit. And the best-selling product? The humble Easy-staple paper!
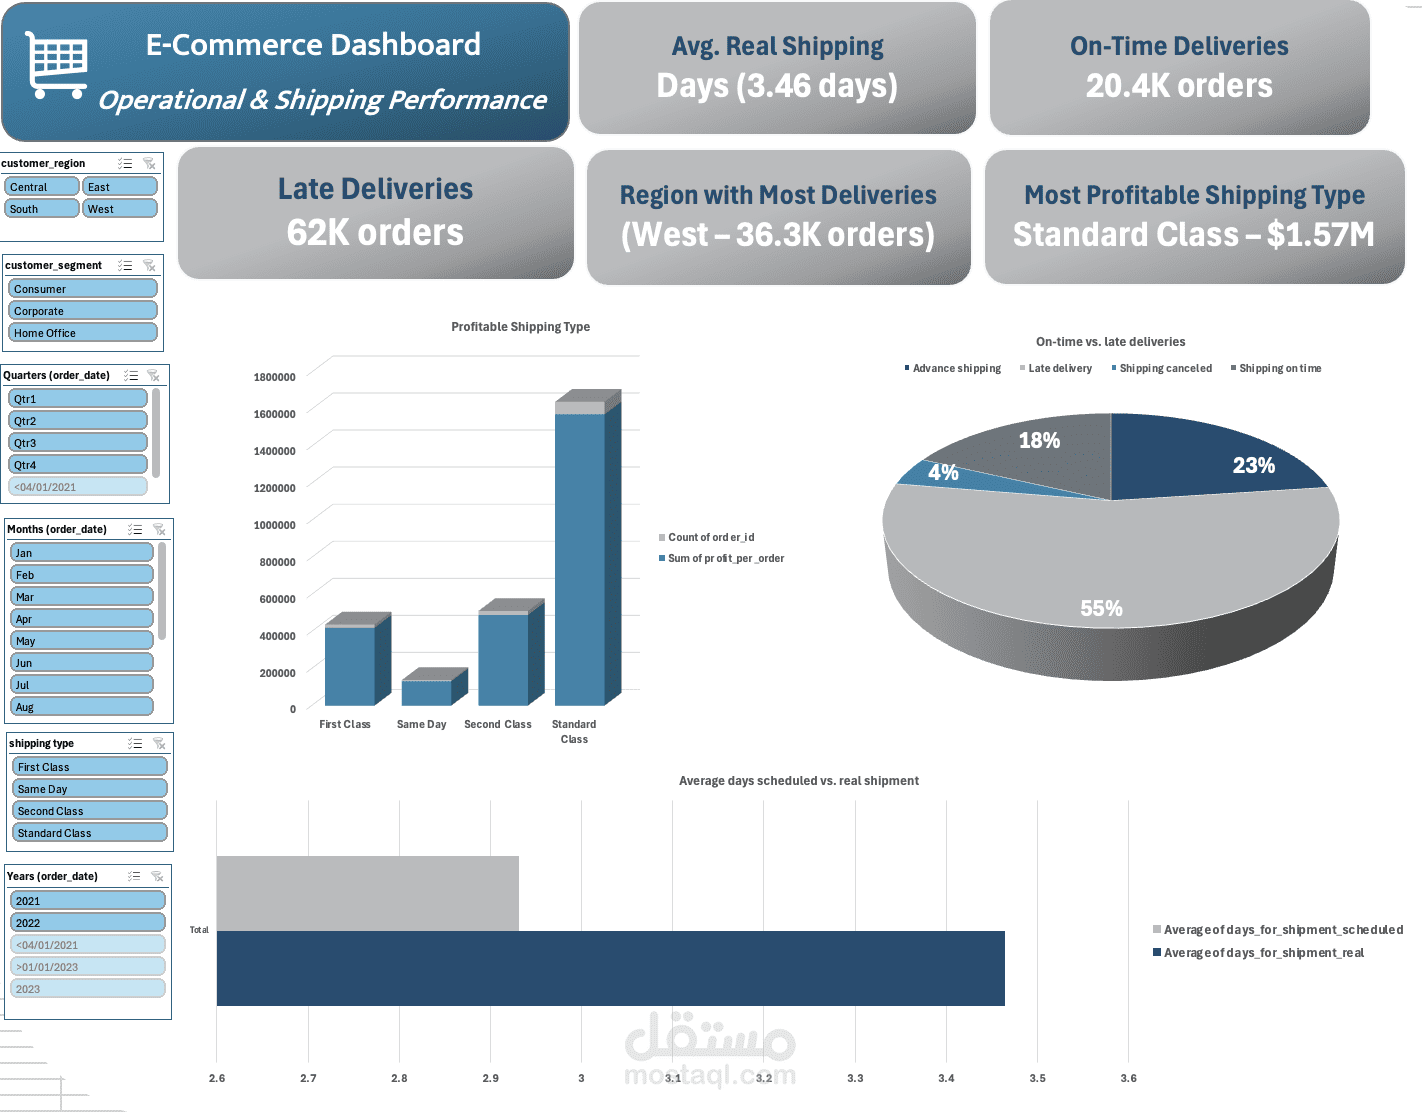
- Operational & Shipping Performance: This is where we found a key opportunity. The dashboard highlighted 62K late deliveries versus 20.4K on-time orders. It also showed that our Standard Class shipping is our most profitable, bringing in $1.57M.
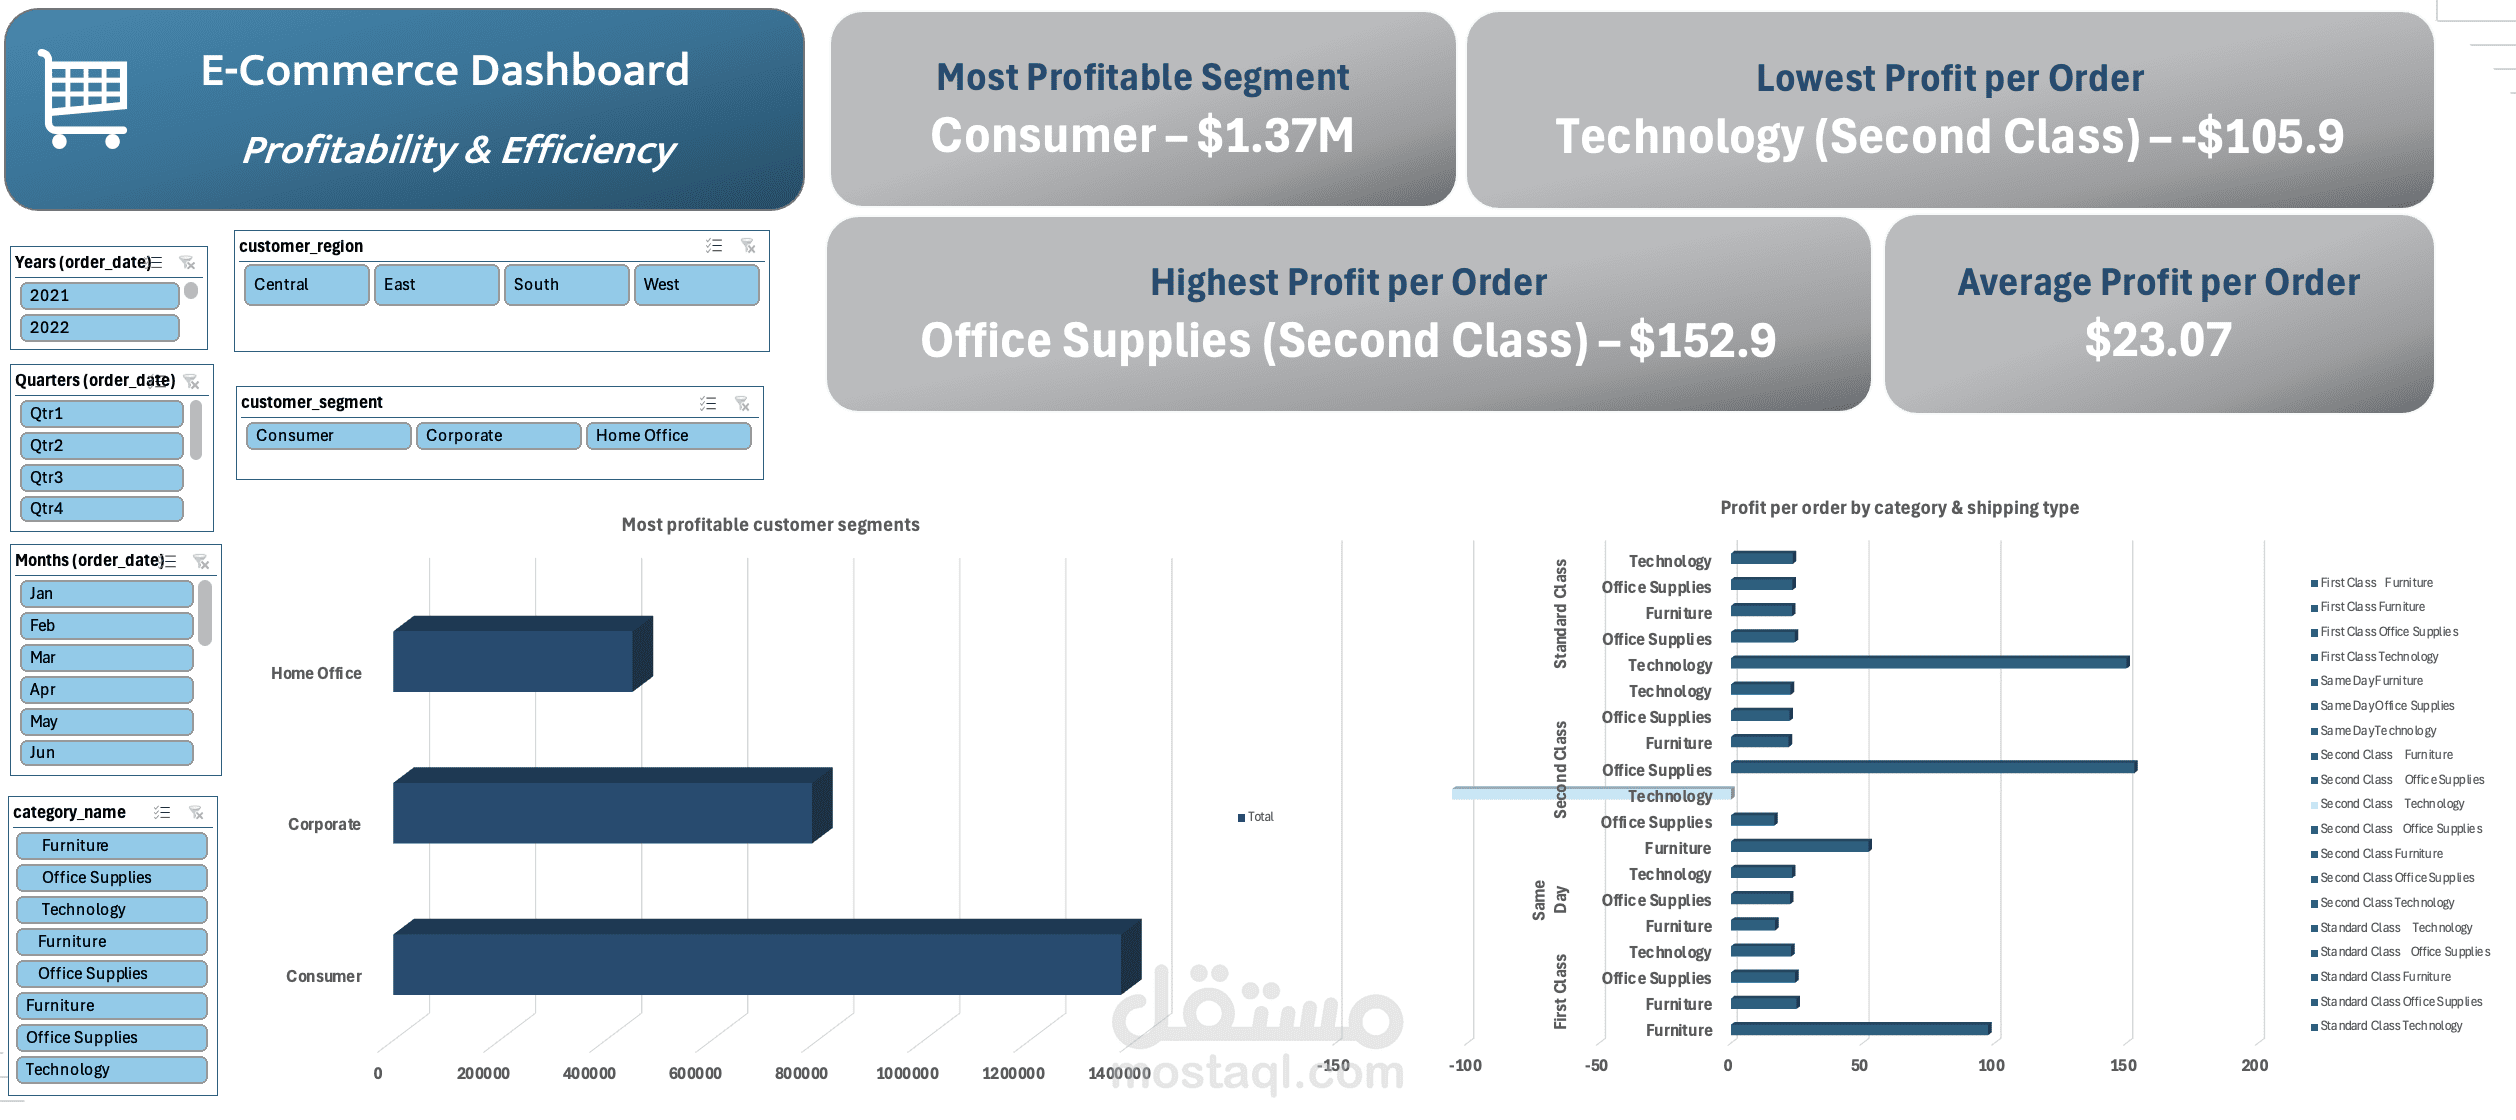
- Profitability & Efficiency: A deep dive into the numbers showed that while most segments are profitable, some products (like Technology in Second Class shipping) are actually losing money per order, a critical insight for future optimization.
Building this project was a huge learning experience, and it truly shows how data can be used to drive real world business decisions.