E-COMMERCE
تفاصيل العمل
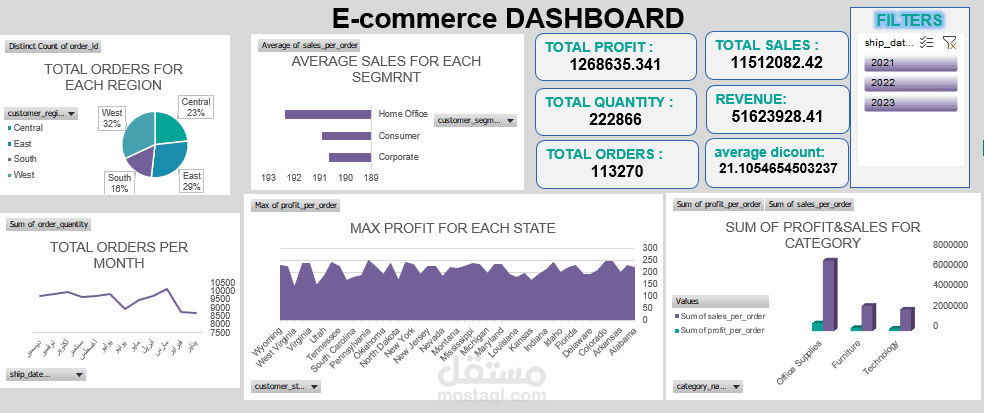
began by using slicers to quickly switch between years (2021–2023) then shaped the visuals to show performance from regional, category, and time-based perspectives.
Core Metrics
▪ Total Orders: 113,270
▪ Total Quantity Sold: 222,866
▪ Total Revenue: 51.62M
▪ Total Sales: 1.15M
▪ Total Profit: 1.27M
▪ Average Discount Given: 21.1%
Insights at a Glance
▪ Leading Regions by Orders: West (32%) & East (29%)
▪ Best-Performing Segment: Home Office
▪ Top States for Profit: California & New York
▪ High-Impact Categories: Technology & Furniture
▪ Monthly Trends: Peaks and dips showing seasonal demand shifts
My design choices focused on balanced layouts, high-contrast colors, and readable fonts — ensuring that the story behind the data comes forward without visual clutter.