Smartphone Analytics Dashboard
تفاصيل العمل
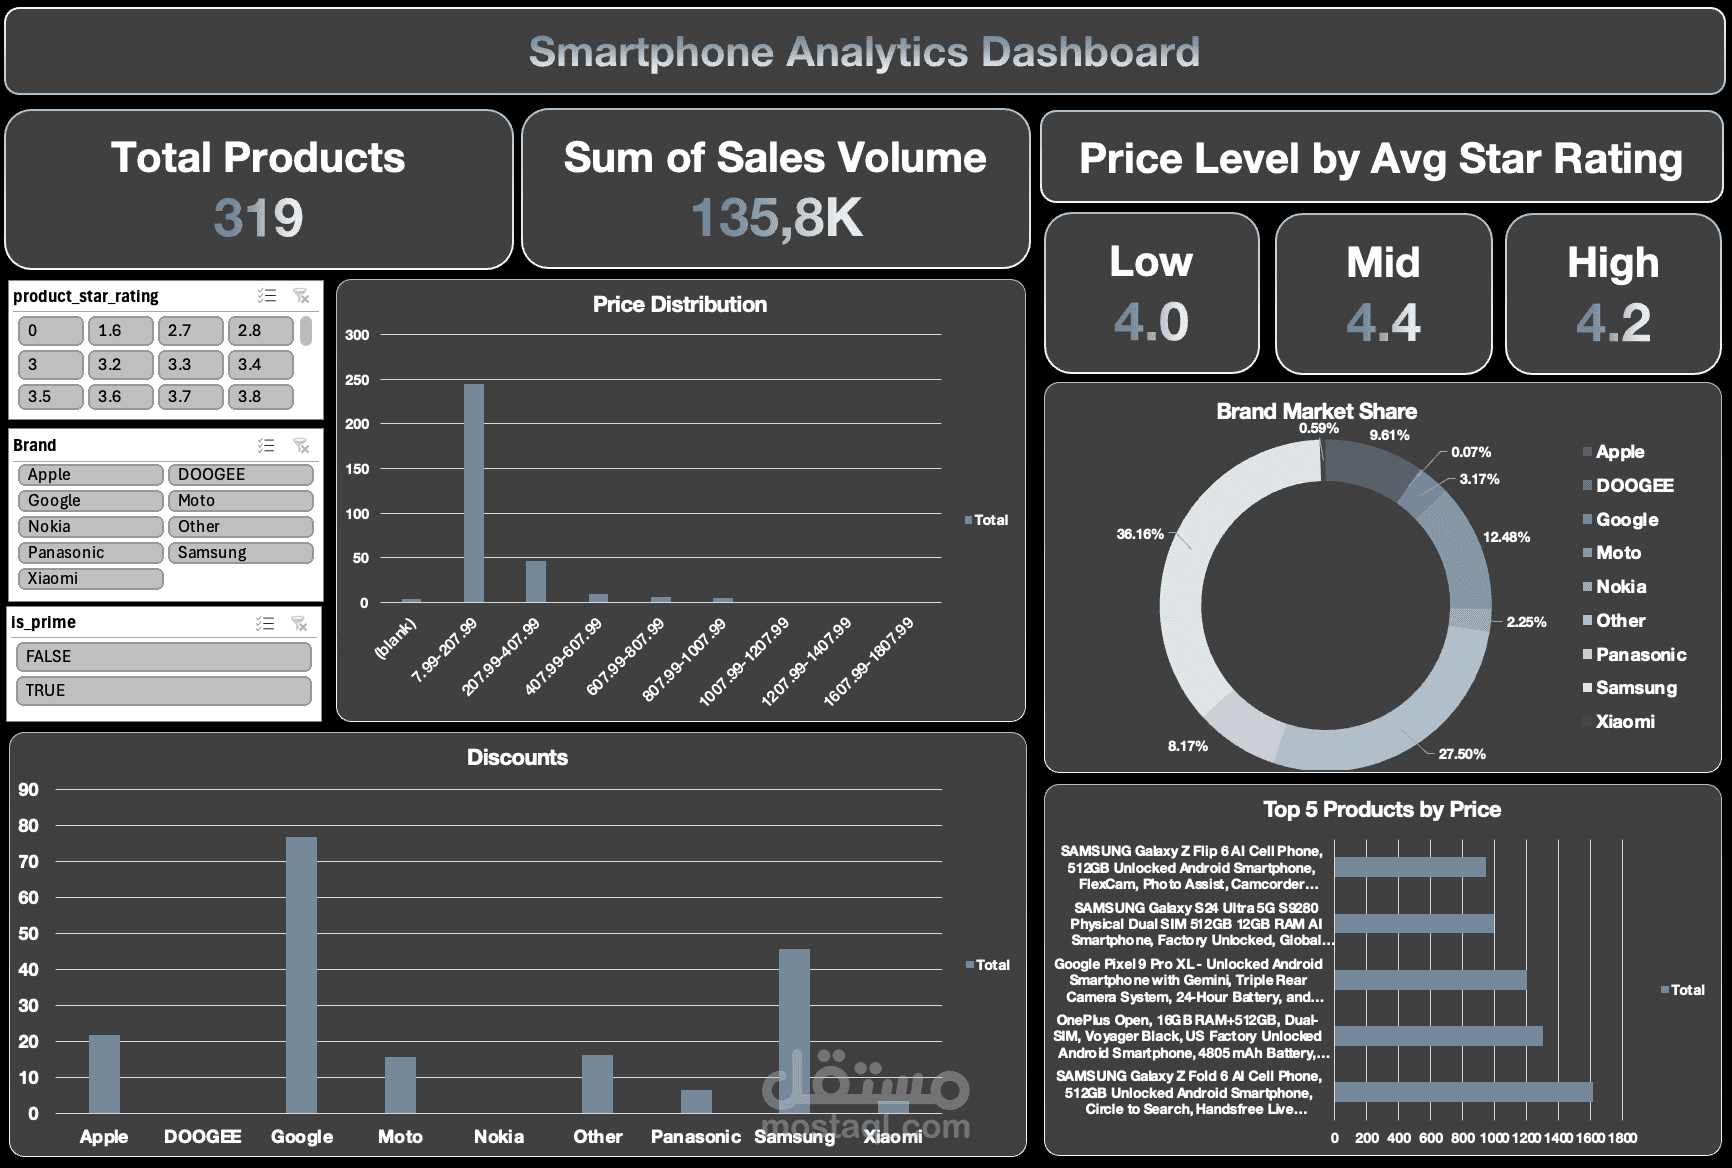
I recently built this dashboard to explore the smartphone market, and here are some of the key findings:
▪️ Low-price smartphones dominate
• The $7.99–$207.99 range has the highest concentration of products.
• As prices rise above $208, the number of available models drops sharply.
▪️ Customer satisfaction sweet spot
• Mid-priced phones still achieve the highest average rating (4.4).
• Low-price phones average 4.0, and high-price phones average 4.2.
• Consumers see the best value-for-money in the mid-tier segment.
▪️ Market concentration
• Samsung (36.2%) leads, followed by Apple (27.5%) and Google (12.5%).
• Smaller brands (DOOGEE, Moto, Nokia, Panasonic, Xiaomi) hold only a small share.
▪️ Discount strategies
• Google & Samsung apply the largest discounts to drive adoption.
• Apple keeps discounts minimal, reinforcing its premium positioning.
▪️ Premium flagships exist, but volume is elsewhere
• High-end devices like Samsung Galaxy Z Fold/Flip and Google Pixel Pro XL dominate the top price levels.
• Yet, the majority of products and sales volume are in the low-price segment (<$208).
The Key Insight: The smartphone market is anchored in affordability, but the highest customer satisfaction is in mid-priced phones. This shows a huge opportunity for brands to balance value, ratings, and smart discounting.
This project reflects my passion for turning data into business insights that can guide better decisions in strategy, sales, and marketing.