Sales Analysis Using Excel
تفاصيل العمل
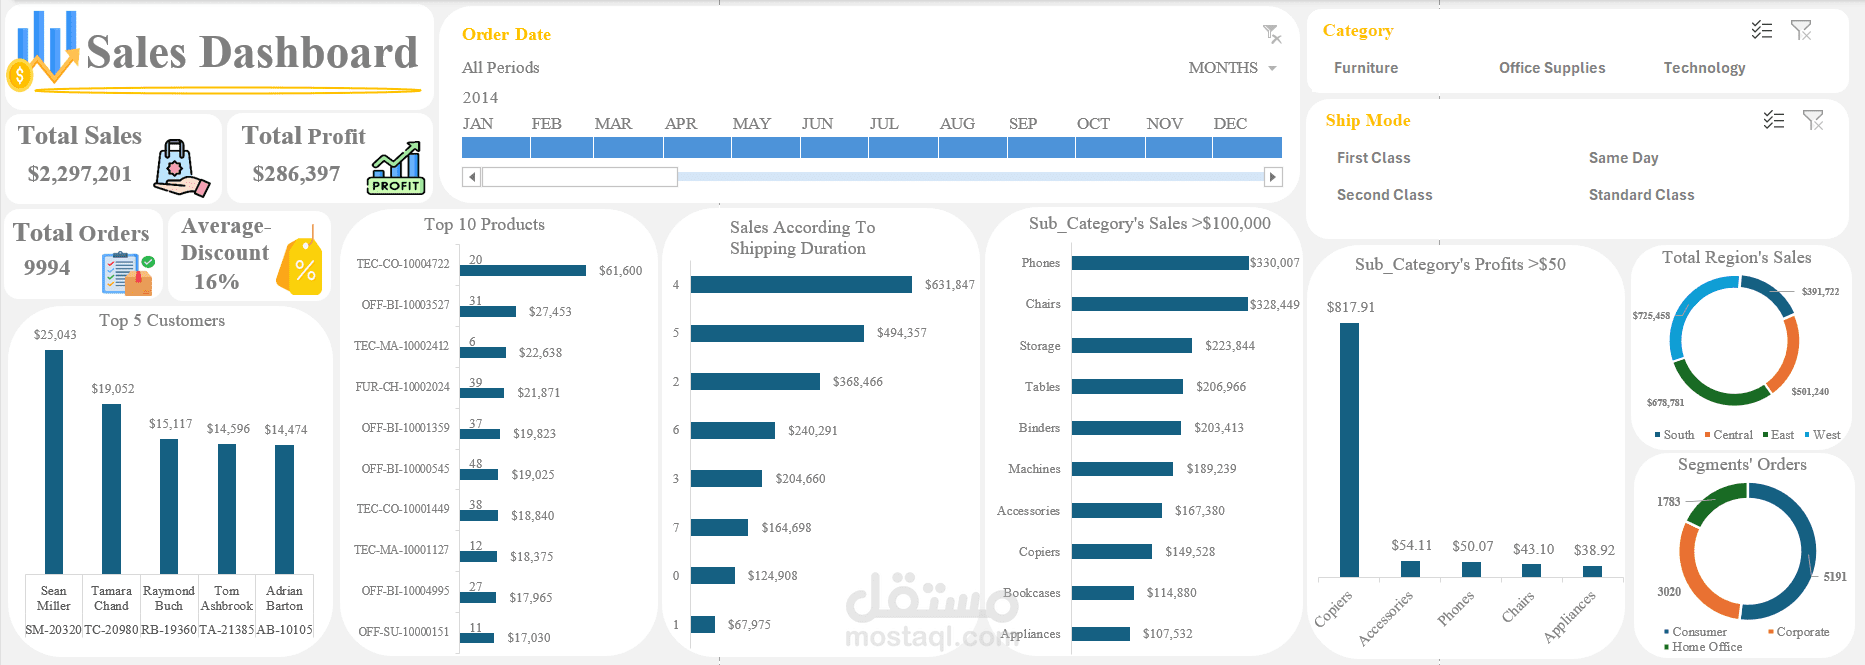
Excel project on Sales Data Analysis! Used formulas, pivot tables, and charts to analyze sales trends
Key KPIs included:
Total Sales:2,297,201$
Total Profit: 286,397$
Total Orders: 994
Average Discount: 16%
Category & Ship mode Slicer: To seamlessly analyse which category is annually purchased and how ship mode affects sales performance
Pie Chart for Regions Sales: To determine how products are distributed across different regions, enhance market distribution
Charts: To figure out the relationship between shipping duration and sales performance, determine top 10 products and 5 top customers, enhance sales process
Year Timeline: To efficiently analyse sales performance across various time period, enable make decisions based on historical data