Sales Dashboard – Business Performance Analysis Using Excel / Power BI
تفاصيل العمل
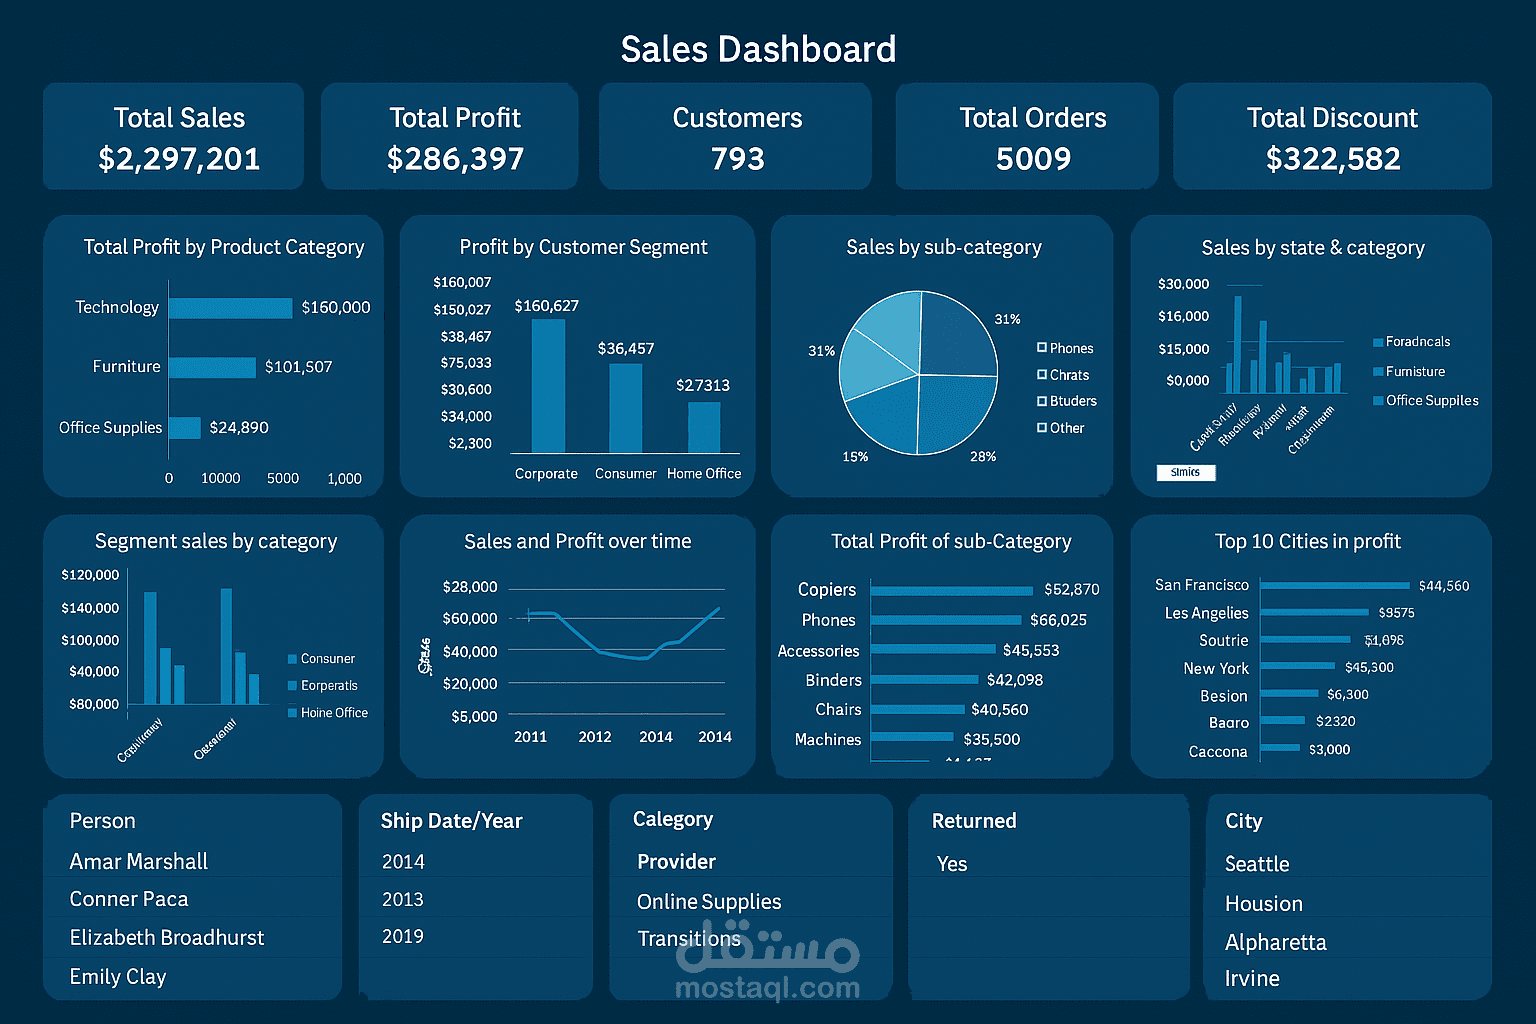

This project showcases a complete Sales Analysis Dashboard designed to monitor and evaluate business performance across different dimensions using Microsoft Excel (or Power BI).
The dashboard provides a clear, interactive overview of key sales metrics, helping decision-makers understand profitability, customer segmentation, and sales distribution across various categories and regions.
It allows users to explore total sales, profit trends, discounts, and customer behaviors through visual insights such as bar charts, pie charts, and line graphs.