Sales Dashboard
تفاصيل العمل
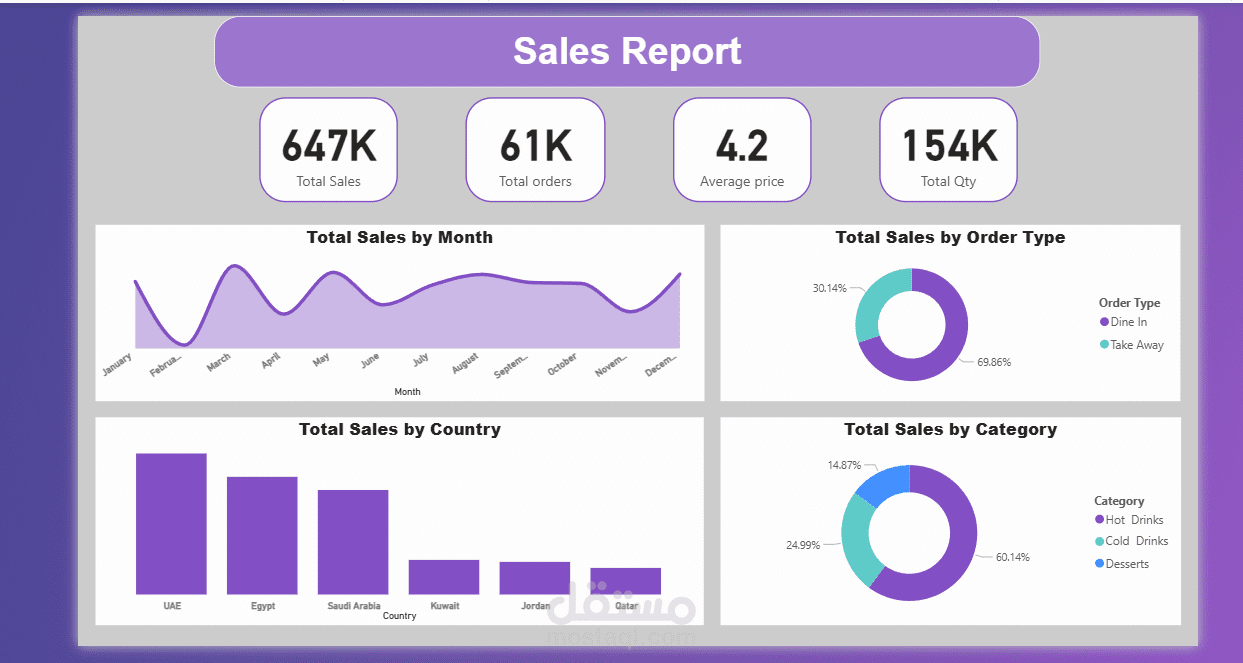
The sales report provides a detailed overview of the company’s performance across key business metrics, customer order types, product categories, and geographical regions.
Key Performance Indicators
Total Sales: 647K
Total Orders: 61K
Average Price per Order: 4.2
Total Quantity Sold: 154K
These figures collectively indicate steady sales activity and consistent customer engagement throughout the reporting period.
Monthly Sales Performance
The “Total Sales by Month” analysis demonstrates fluctuations in sales across the year. Notable peaks occur in March and December, suggesting periods of increased customer demand, possibly driven by seasonal or promotional factors.
Sales Distribution by Order Type
Dine In: 69.86%
Take Away: 30.14%
Dine-in orders represent the dominant share of total sales, highlighting the importance of in-house customer experience and service quality in driving revenue.
Sales by Country
The United Arab Emirates (UAE) leads in total sales volume, followed by Egypt and Saudi Arabia. Smaller yet significant contributions are made by Kuwait, Jordan, and Qatar, indicating emerging opportunities for market expansion and customer acquisition in these regions.
Sales by Product Category
Hot Drinks: 60.14%
Cold Drinks: 24.99%
Desserts: 14.87%
The data shows that Hot Drinks remain the core revenue driver, accounting for over half of total sales. Cold Drinks and Desserts provide additional revenue streams, suggesting potential areas for promotional focus or product diversification.