Phone Dashboard
تفاصيل العمل
- بدأتُ العمل على ملف غير منظم، يحتوي على بيانات مبيعات الهواتف من عدة علامات تجارية. باستخدام Power Query، قمت بـ:
تنظيف وتحويل أكثر من 20 عمودًا لضمان الدقة في البيانات.
تحليل وتوحيد بيانات حجم المبيعات، بما في ذلك القيم التي تحتوي على لاحقة "K".
إزالة التكرارات والحقول غير المهمة.
استخراج أسماء العلامات التجارية من عناوين المنتجات.
- التصنيف والتحليل باستخدام DAX
بعد تنظيف البيانات، استخدمت DAX داخل Power Pivot لتنفيذ:
تصنيف الهواتف إلى فئات سعرية: منخفضة، متوسطة، وعالية.
إنشاء فترات سعرية مخصصة لتحليل منظم.
حساب الفرق بين السعر الأصلي وسعر البيع الفعلي لتحليل أنماط الخصومات.
- الجداول المحورية والرسوم البيانية (Pivot Tables and Visuals)
أنشأت عدة جداول محورية لاستكشاف:
حجم المبيعات حسب العلامة التجارية، مع مقارنة أداء Samsung، iPhone، Nokia، وغيرها.
توزيع المنتجات حسب الفئة السعرية.
متوسط التقييم لكل فئة سعرية.
مؤشرات رئيسية مثل:
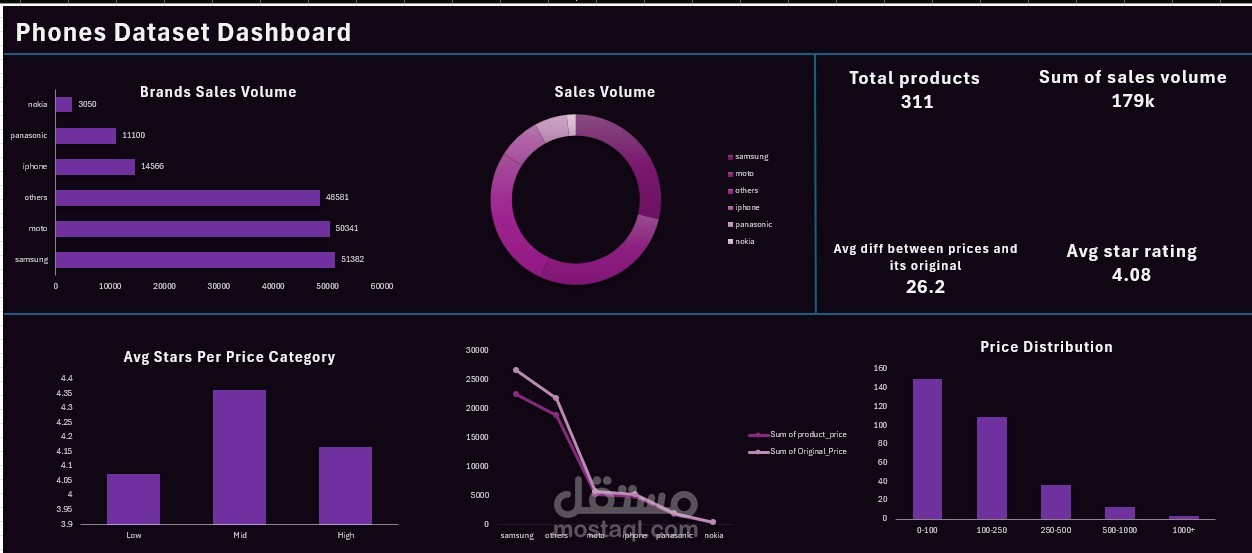
إجمالي عدد المنتجات: 311
إجمالي حجم المبيعات: 179 ألف
متوسط الفرق بين السعر الأصلي وسعر البيع: 26.2
متوسط التقييم: 4.08
- لوحة المعلومات النهائية (داشبورد)
كل هذه التحليلات تم دمجها داخل لوحة معلومات تفاعلية واحدة باستخدام Excel، مصممة بأسلوب بسيط وواضح يسهّل اتخاذ القرار. تتضمن الداشبورد:
مخطط شريطي لحجم مبيعات العلامات التجارية: يوضح تفوق Samsung وiPhone.
مخطط دائري لتوزيع المبيعات: يعرض النسب لكل علامة تجارية.
رسم بياني لعدد المنتجات حسب الفئة السعرية.
تحليل الفرق ما بين السعر الأساسي وسعر البيع حسب العلامة التجارية.