Sales Analysis (ُExcel)
تفاصيل العمل
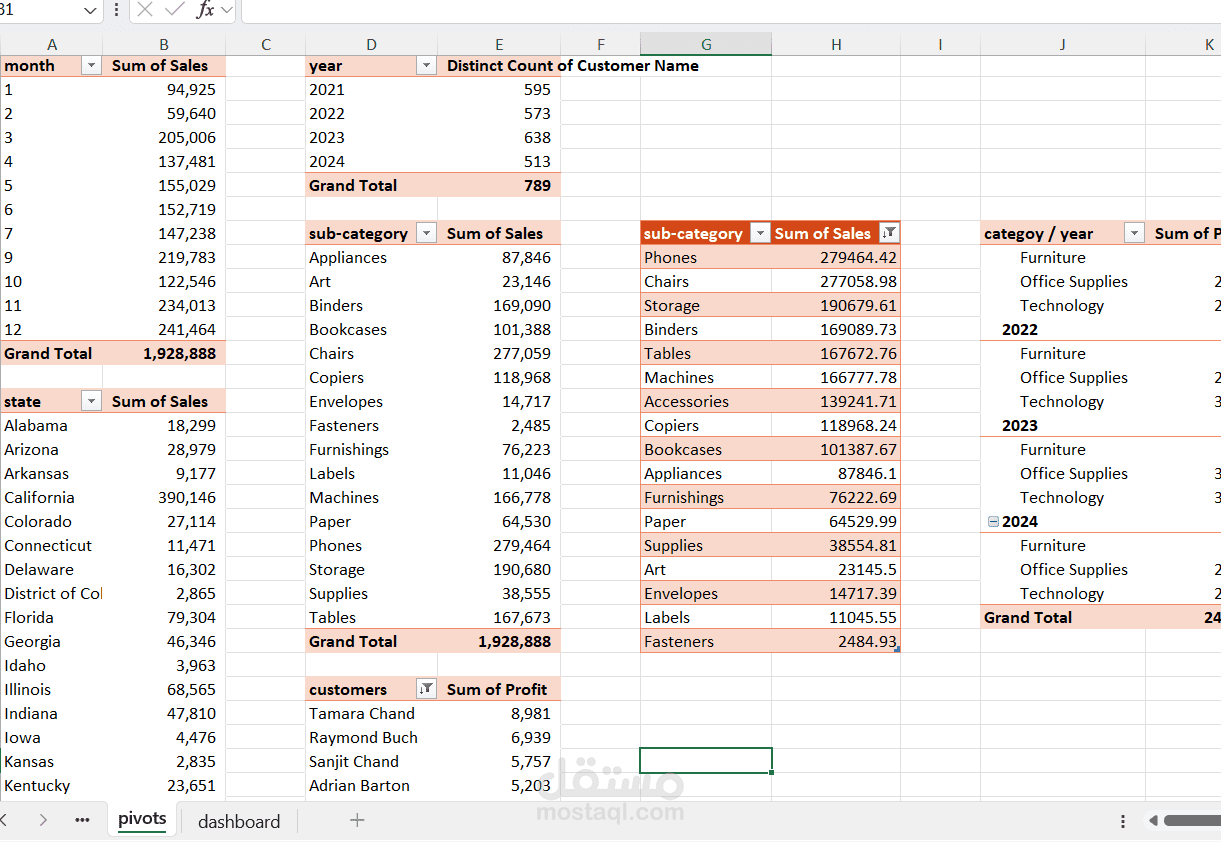
This project showcases a comprehensive Sales Analysis Dashboard built in Excel using pivot tables to transform raw data into meaningful business insights.
It highlights key metrics such as:
Total Sales Performance across months, states, and years.
Top-Performing Products and Sub-Categories driving revenue.
Customer Profitability Analysis to identify high-value clients.
Category Trends by Year, revealing sales growth patterns over time.
This dashboard provides a clear, interactive view of business performance, empowering decision-makers to track progress, discover trends, and make informed, data-driven decisions