Manchester United Performance Analytics Dashboard | Power BI Football Analytics
تفاصيل العمل
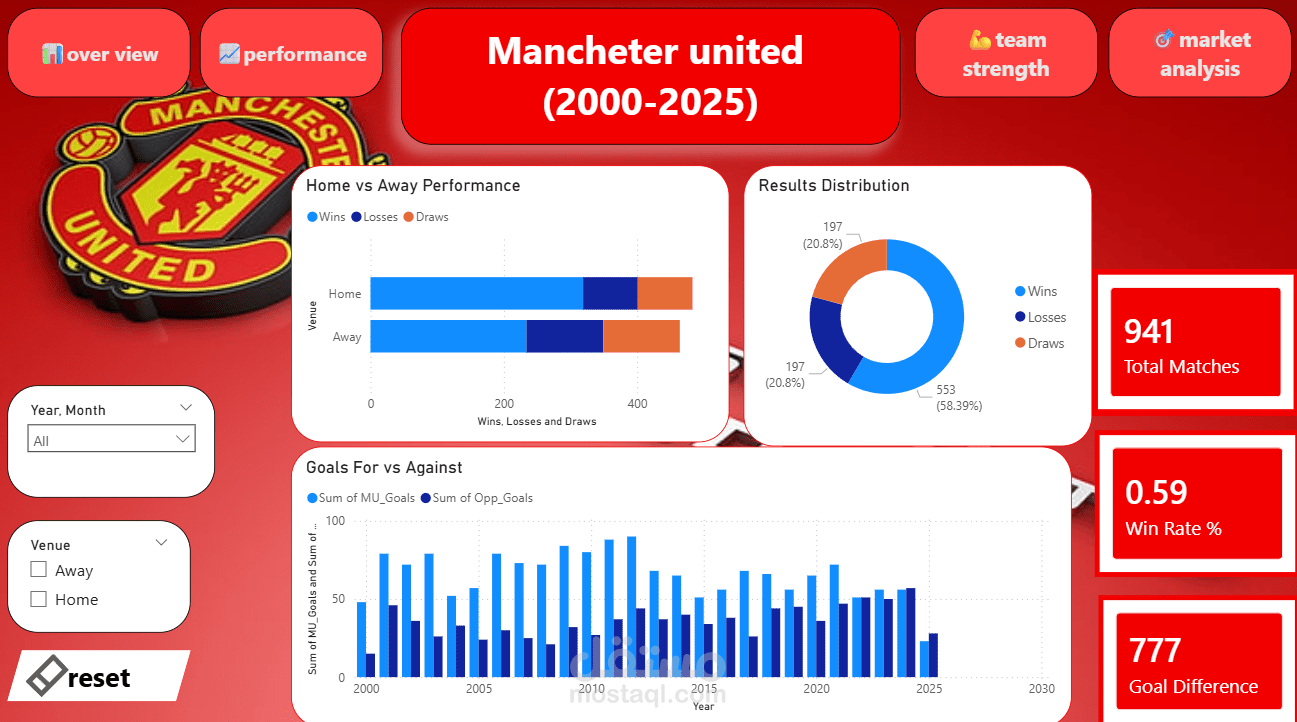
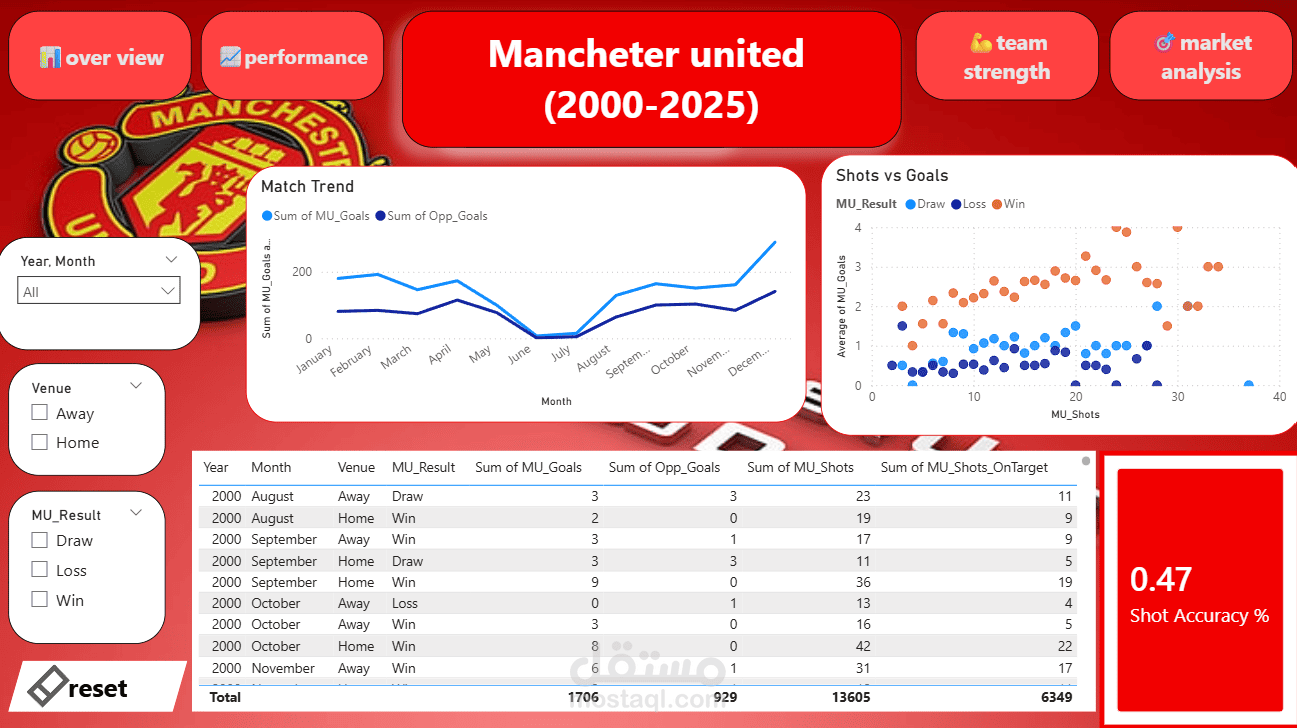
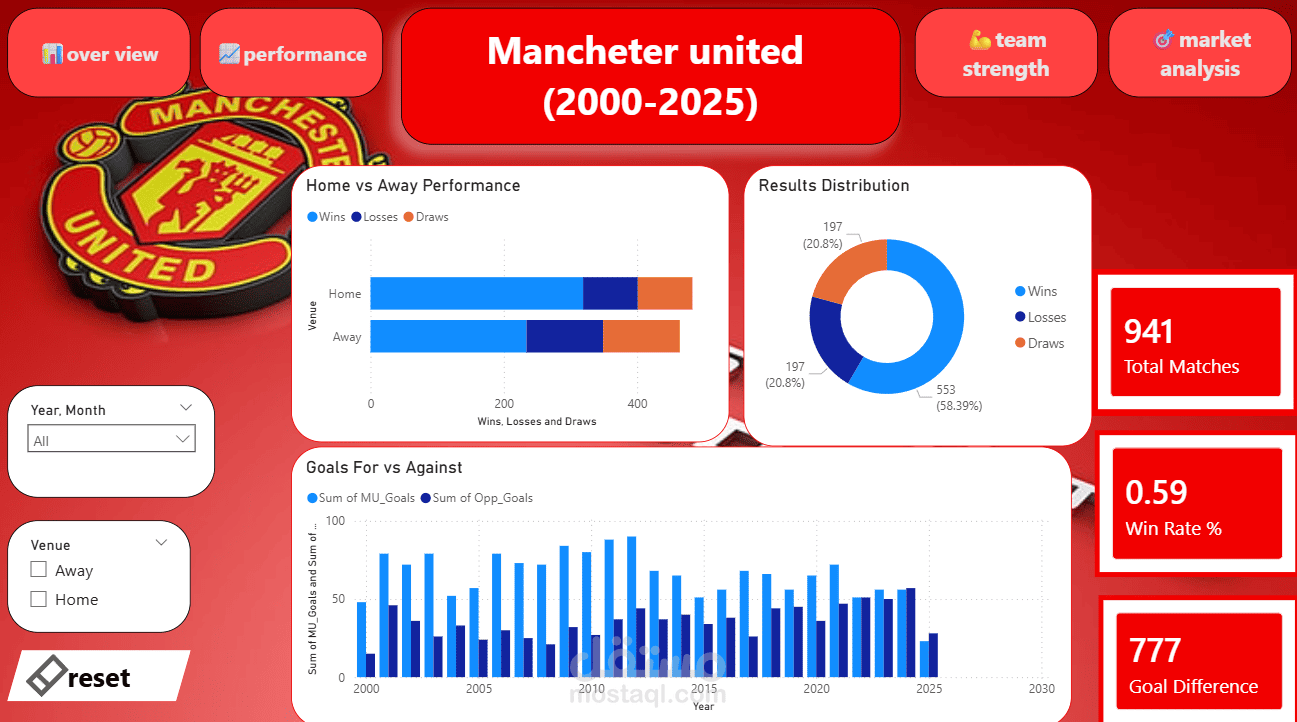
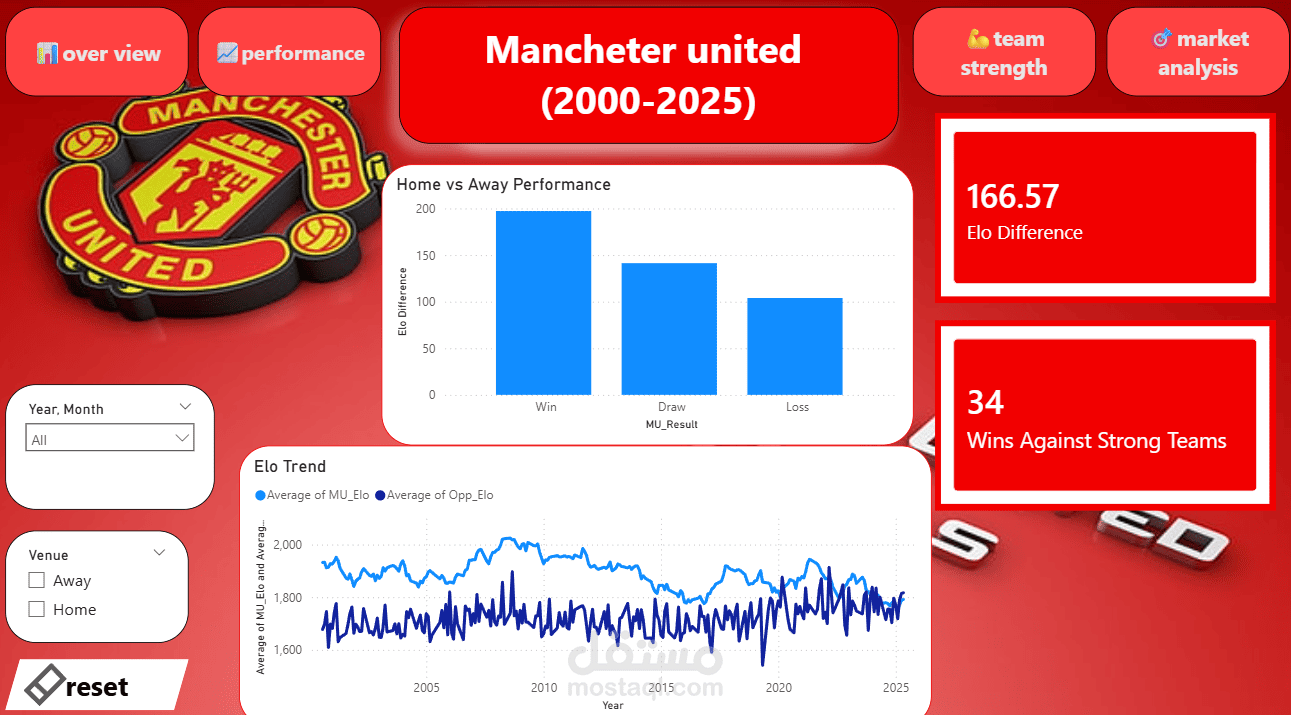
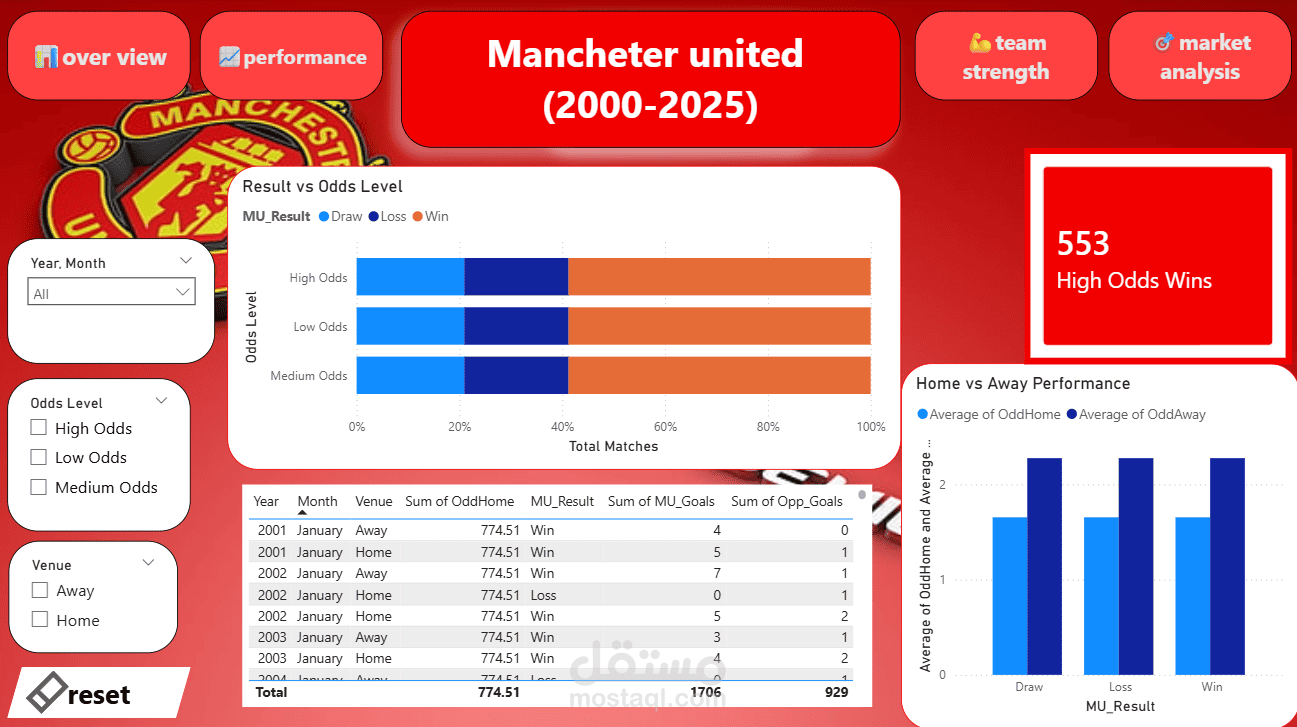
An end-to-end Power BI analytics project analyzing Manchester United performance from 2000–2025.
This interactive dashboard combines match statistics, team strength analysis (Elo ratings), and betting market data to provide a complete view of long-term performance trends and competitive analysis.
The project focuses on transforming raw football data into meaningful insights through data cleaning, modeling, KPI development, and interactive visualization.
Key analysis includes:
- Match performance and win/loss trends
- Home vs away performance comparison
- Goal scoring patterns and attacking efficiency
- Elo rating trends and opponent strength analysis
- Betting odds and market expectation analysis
Tools Used:
Power BI, Power Query, DAX, Data Modeling
The dashboard helps analysts and decision-makers evaluate team performance, identify trends, and support data-driven football strategies.