AI Dashboard
تفاصيل العمل
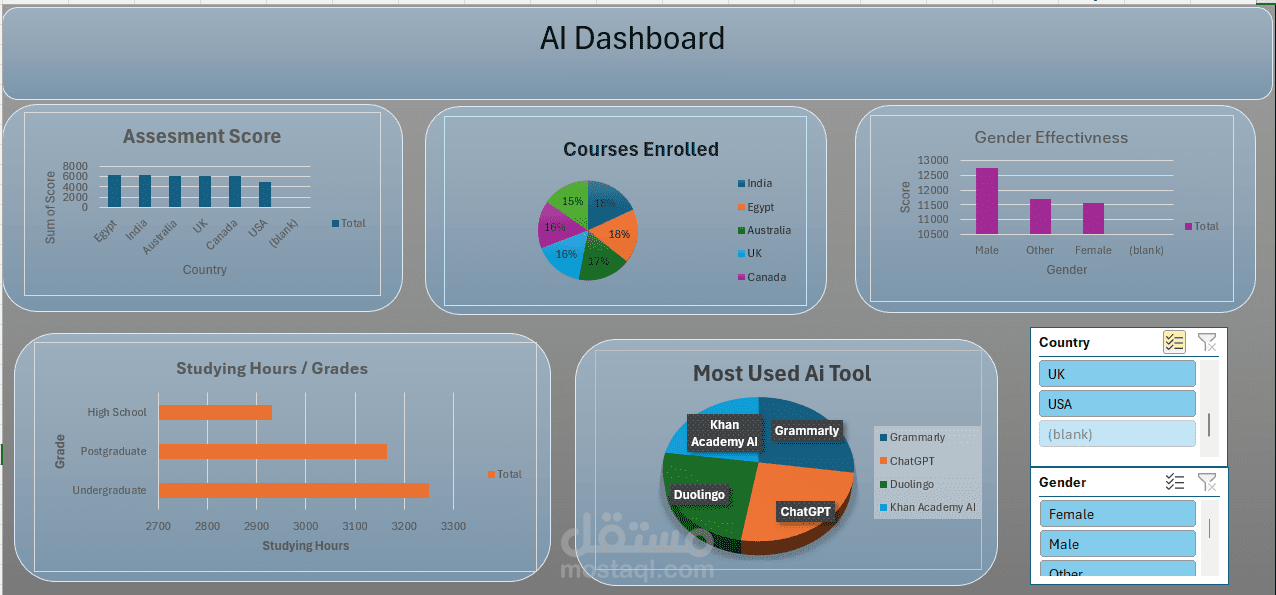
The project went through multiple stages:
Started by using Query to clean and prepare the data.
Then applied Pivot Tables to extract key insights and highlight main trends.
Finally, presented the findings using Charts and Visualizations to make the results clear and easy to
understand