HR Attrition Dashboard
تفاصيل العمل

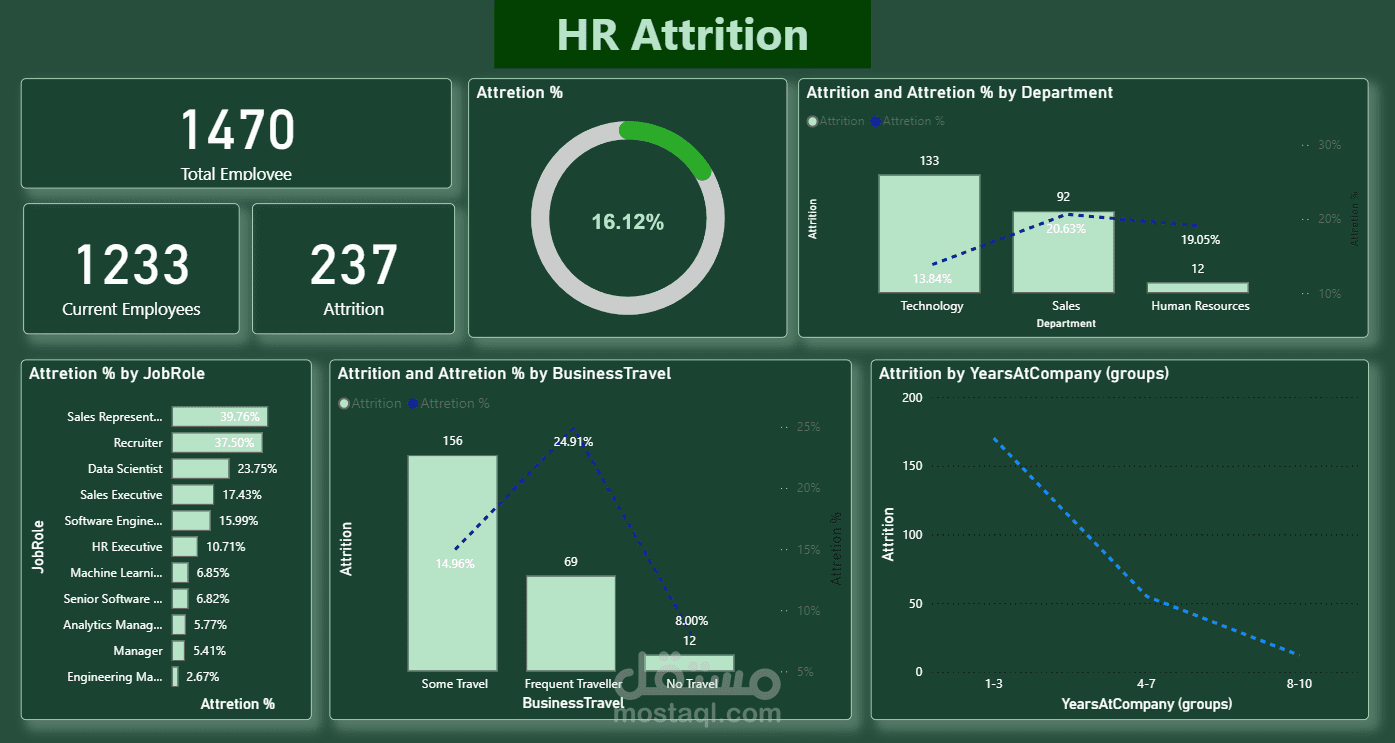
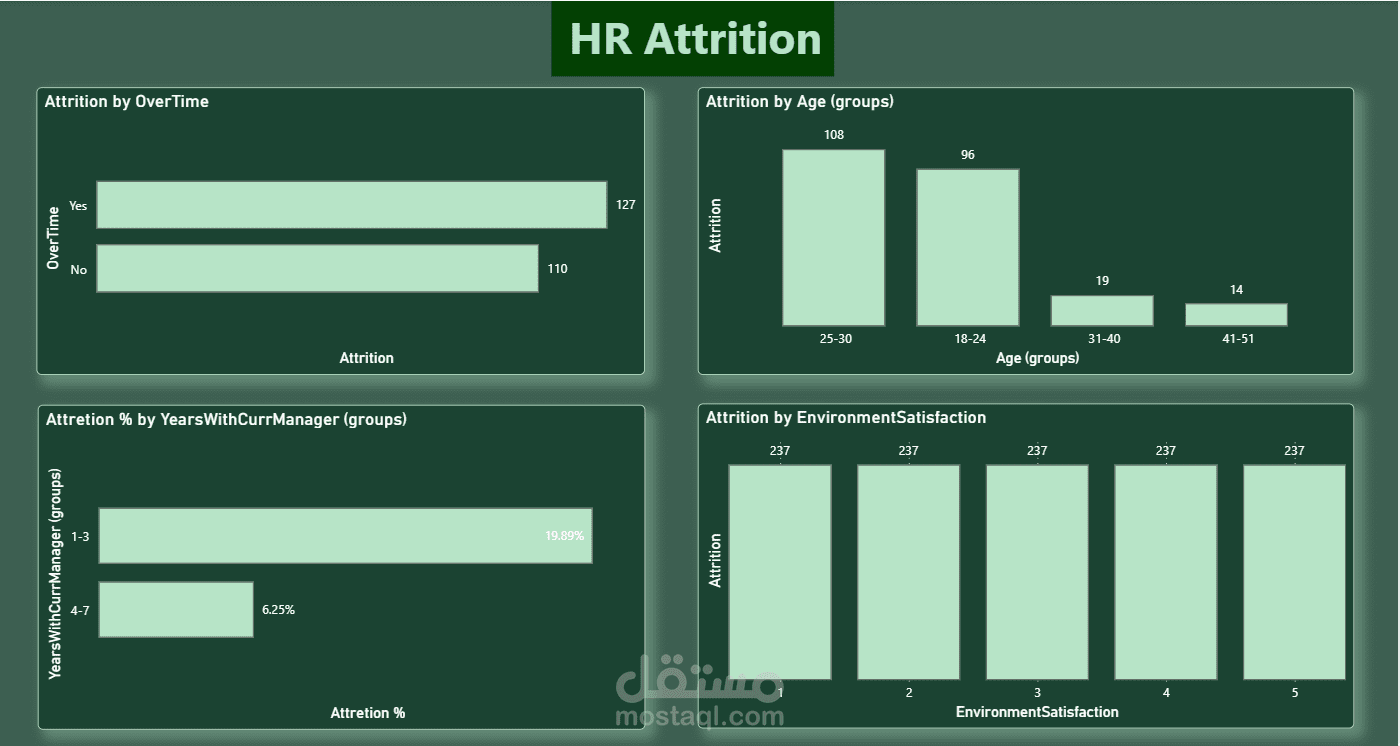
An interactive dashboard was created using Power BI to analyze and present data through charts and Key Performance Indicators (KPIs). The project aims to simplify complex data, making it easier to track performance and make data-driven decisions.