Market Sales Dashboard
تفاصيل العمل
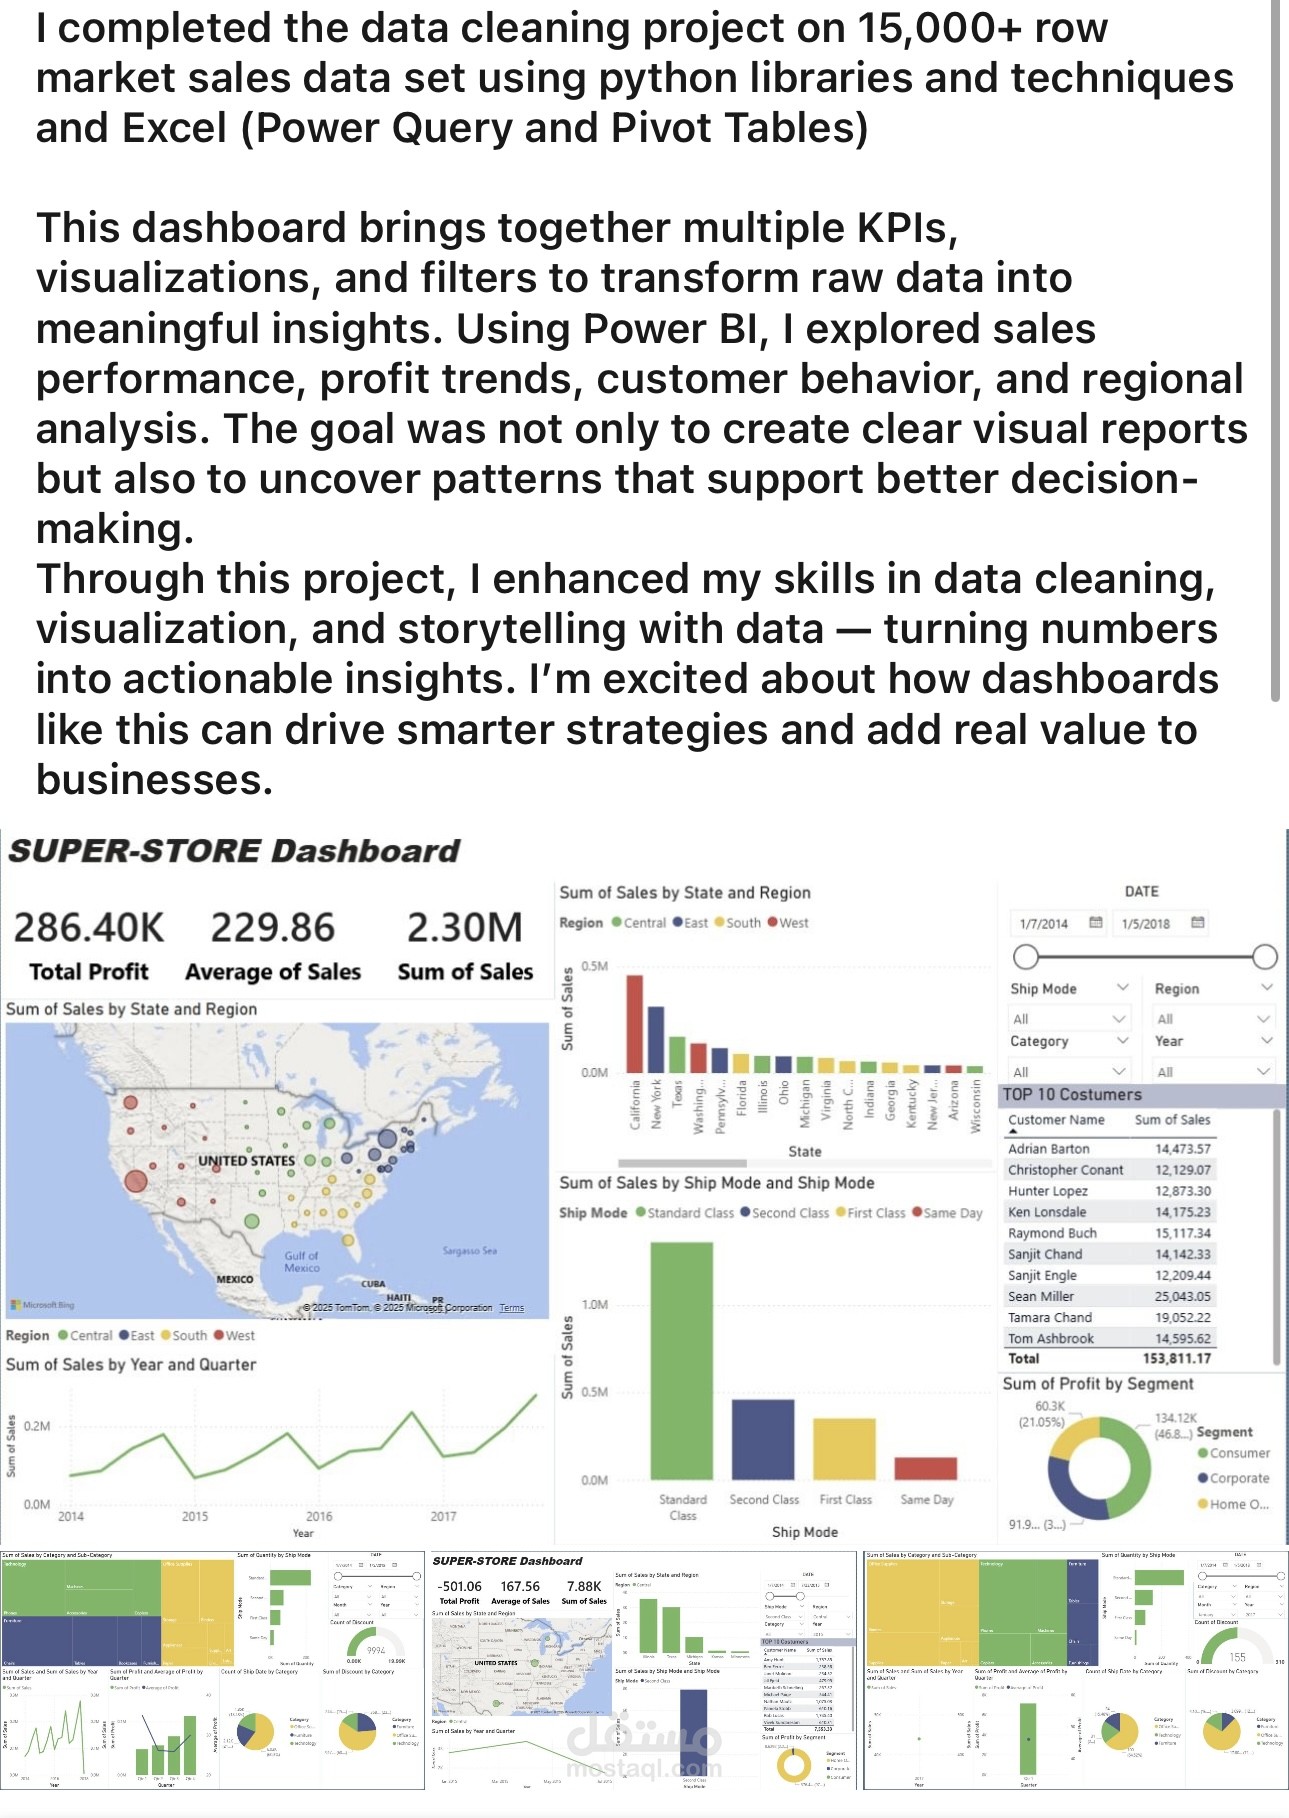
I completed the data cleaning project on 15,000+ row market sales data set using python libraries and techniques and Excel (Power Query and Pivot Tables)
This dashboard brings together multiple KPIs, visualizations, and filters to transform raw data into meaningful insights. Using Power BI, I explored sales performance, profit trends, customer behavior, and regional analysis. The goal was not only to create clear visual reports but also to uncover patterns that support better decision-making.
Through this project, I enhanced my skills in data cleaning, visualization, and storytelling with data — turning numbers into actionable insights. I’m excited about how dashboards like this can drive smarter strategies and add real value to businesses.