Price Difference and Its Effect on Sales (2003–2005)
تفاصيل العمل
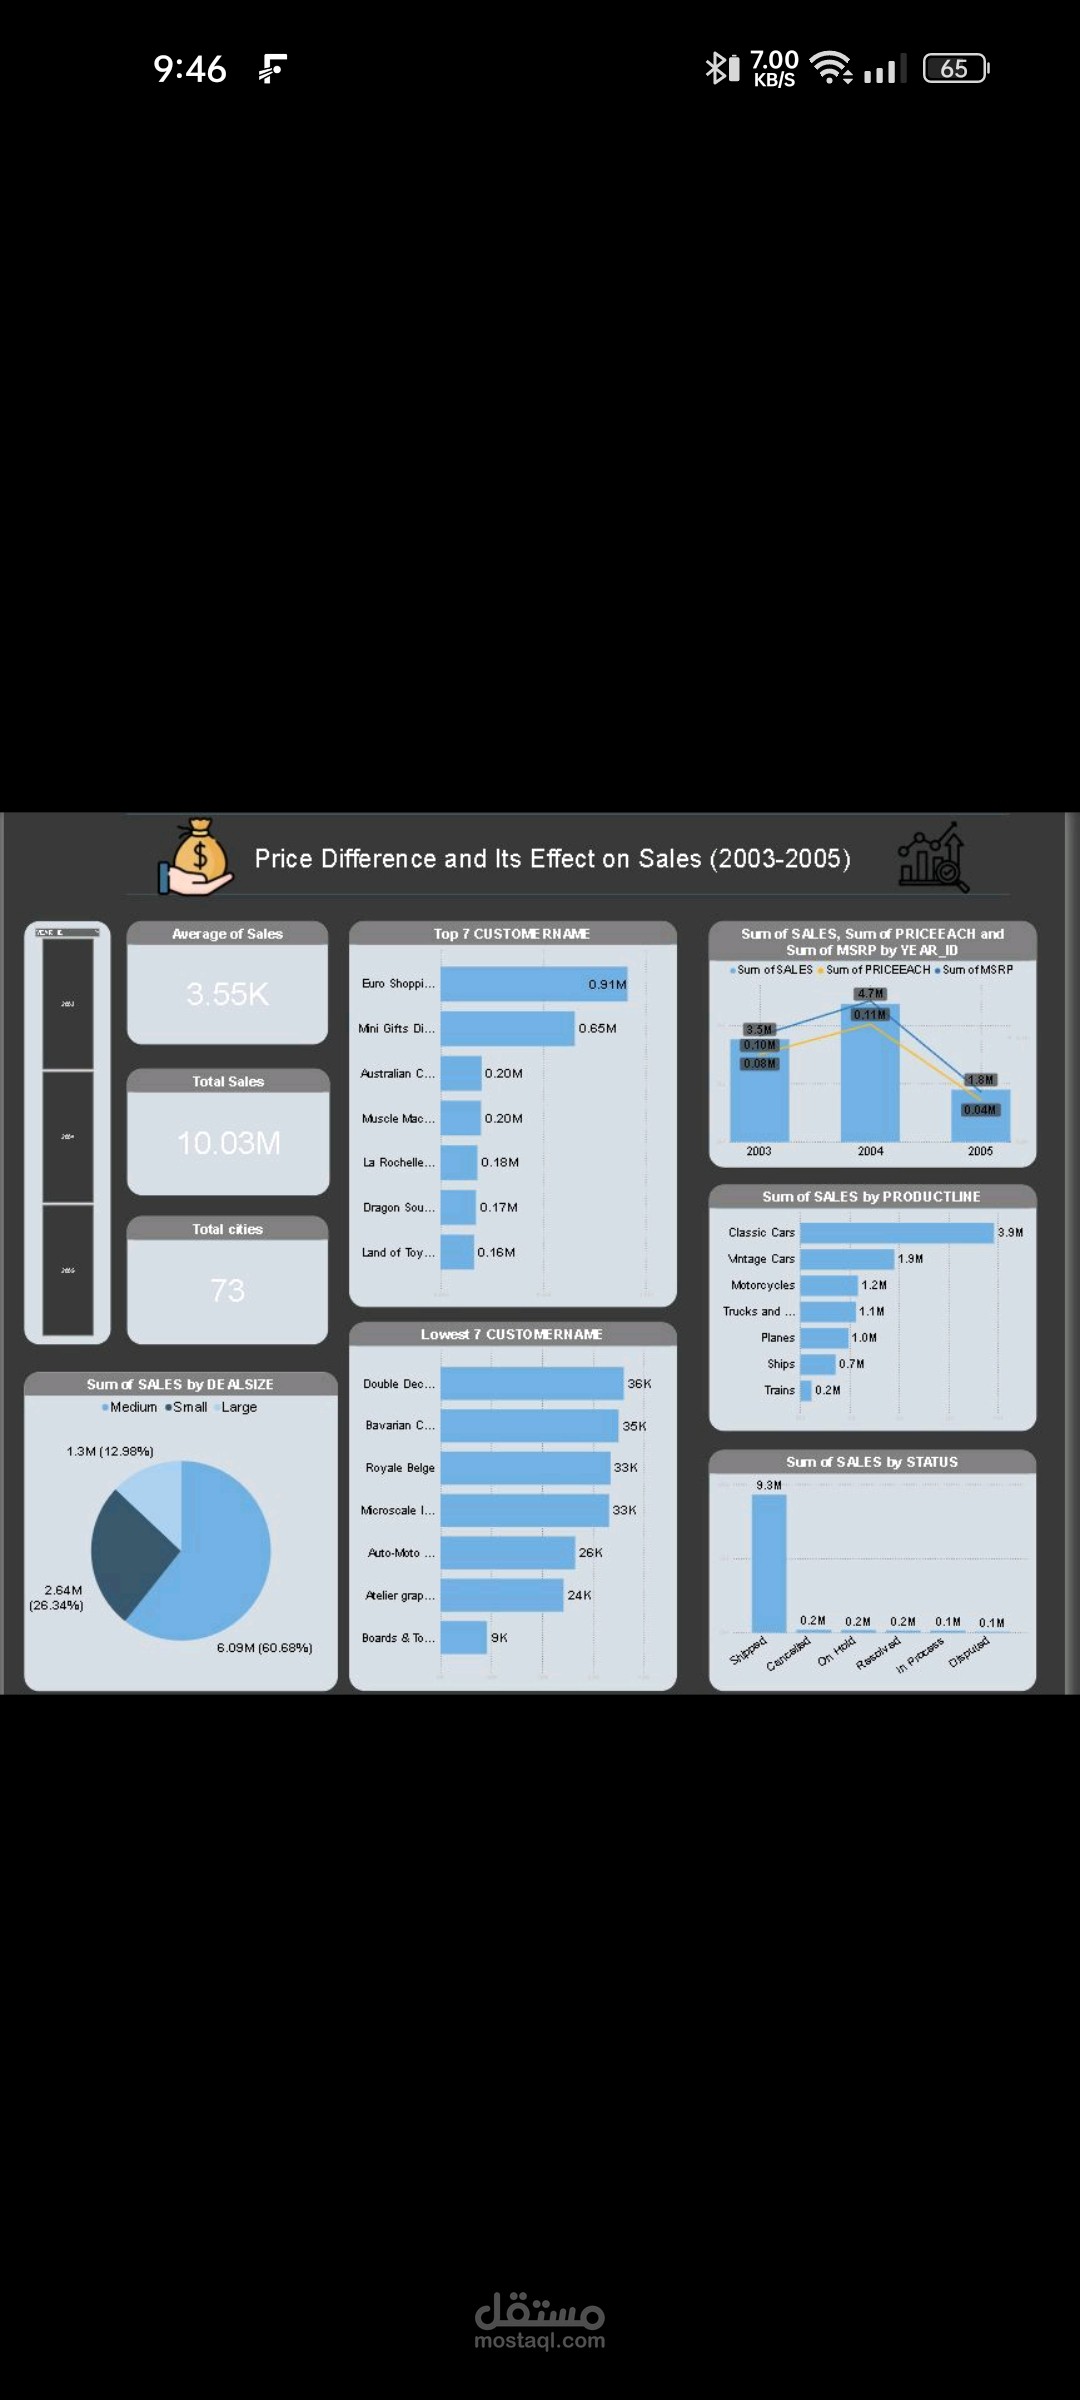
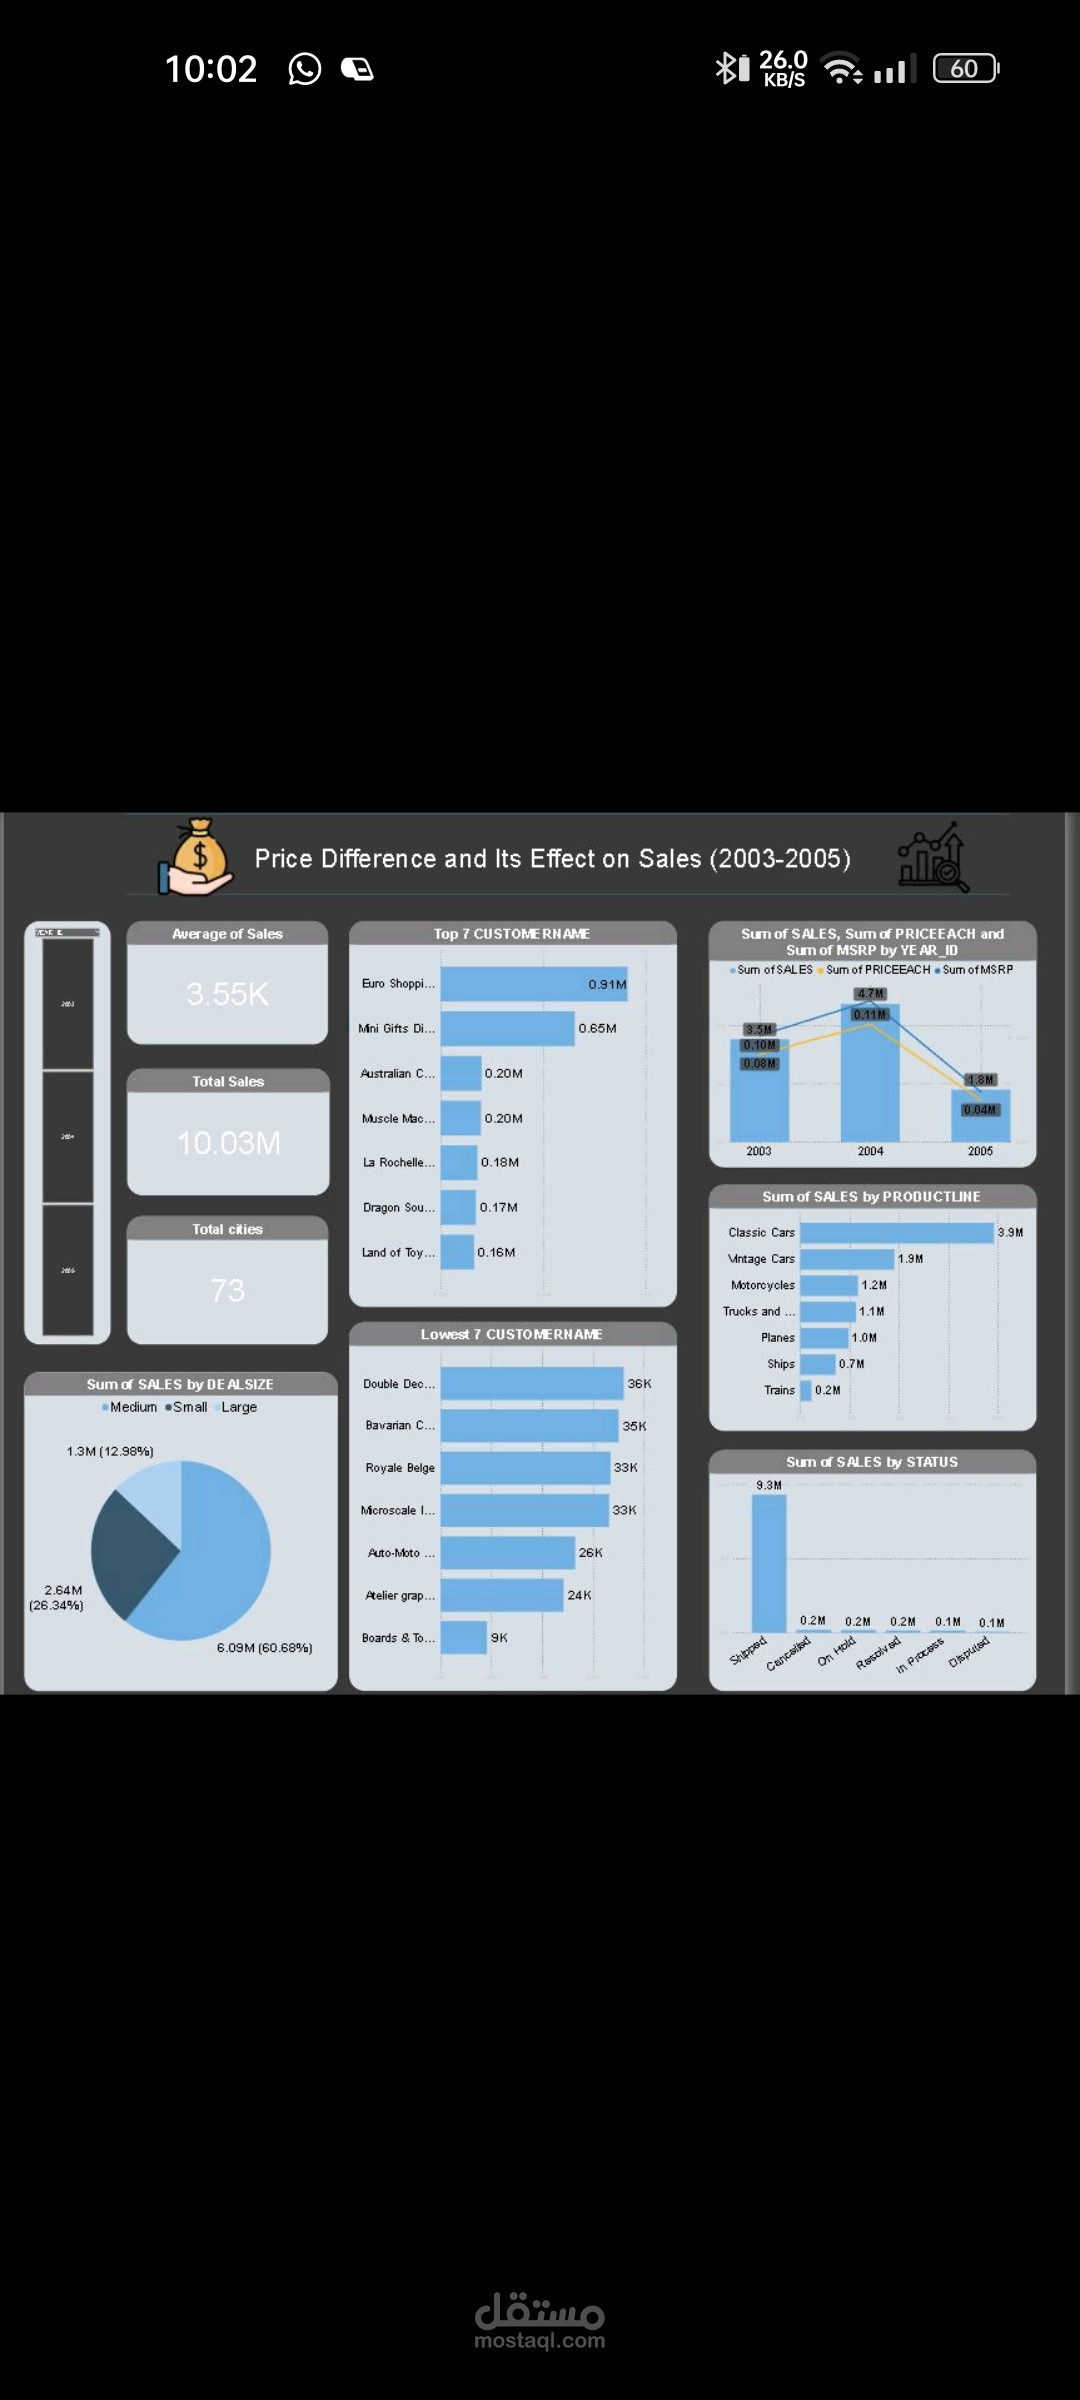

In this Power BI dashboard, I explored how pricing variations influenced overall sales performance across multiple markets. Here are some of the key findings:
Total Sales: $10.03M across 73 cities with an average of 3.55K per transaction.
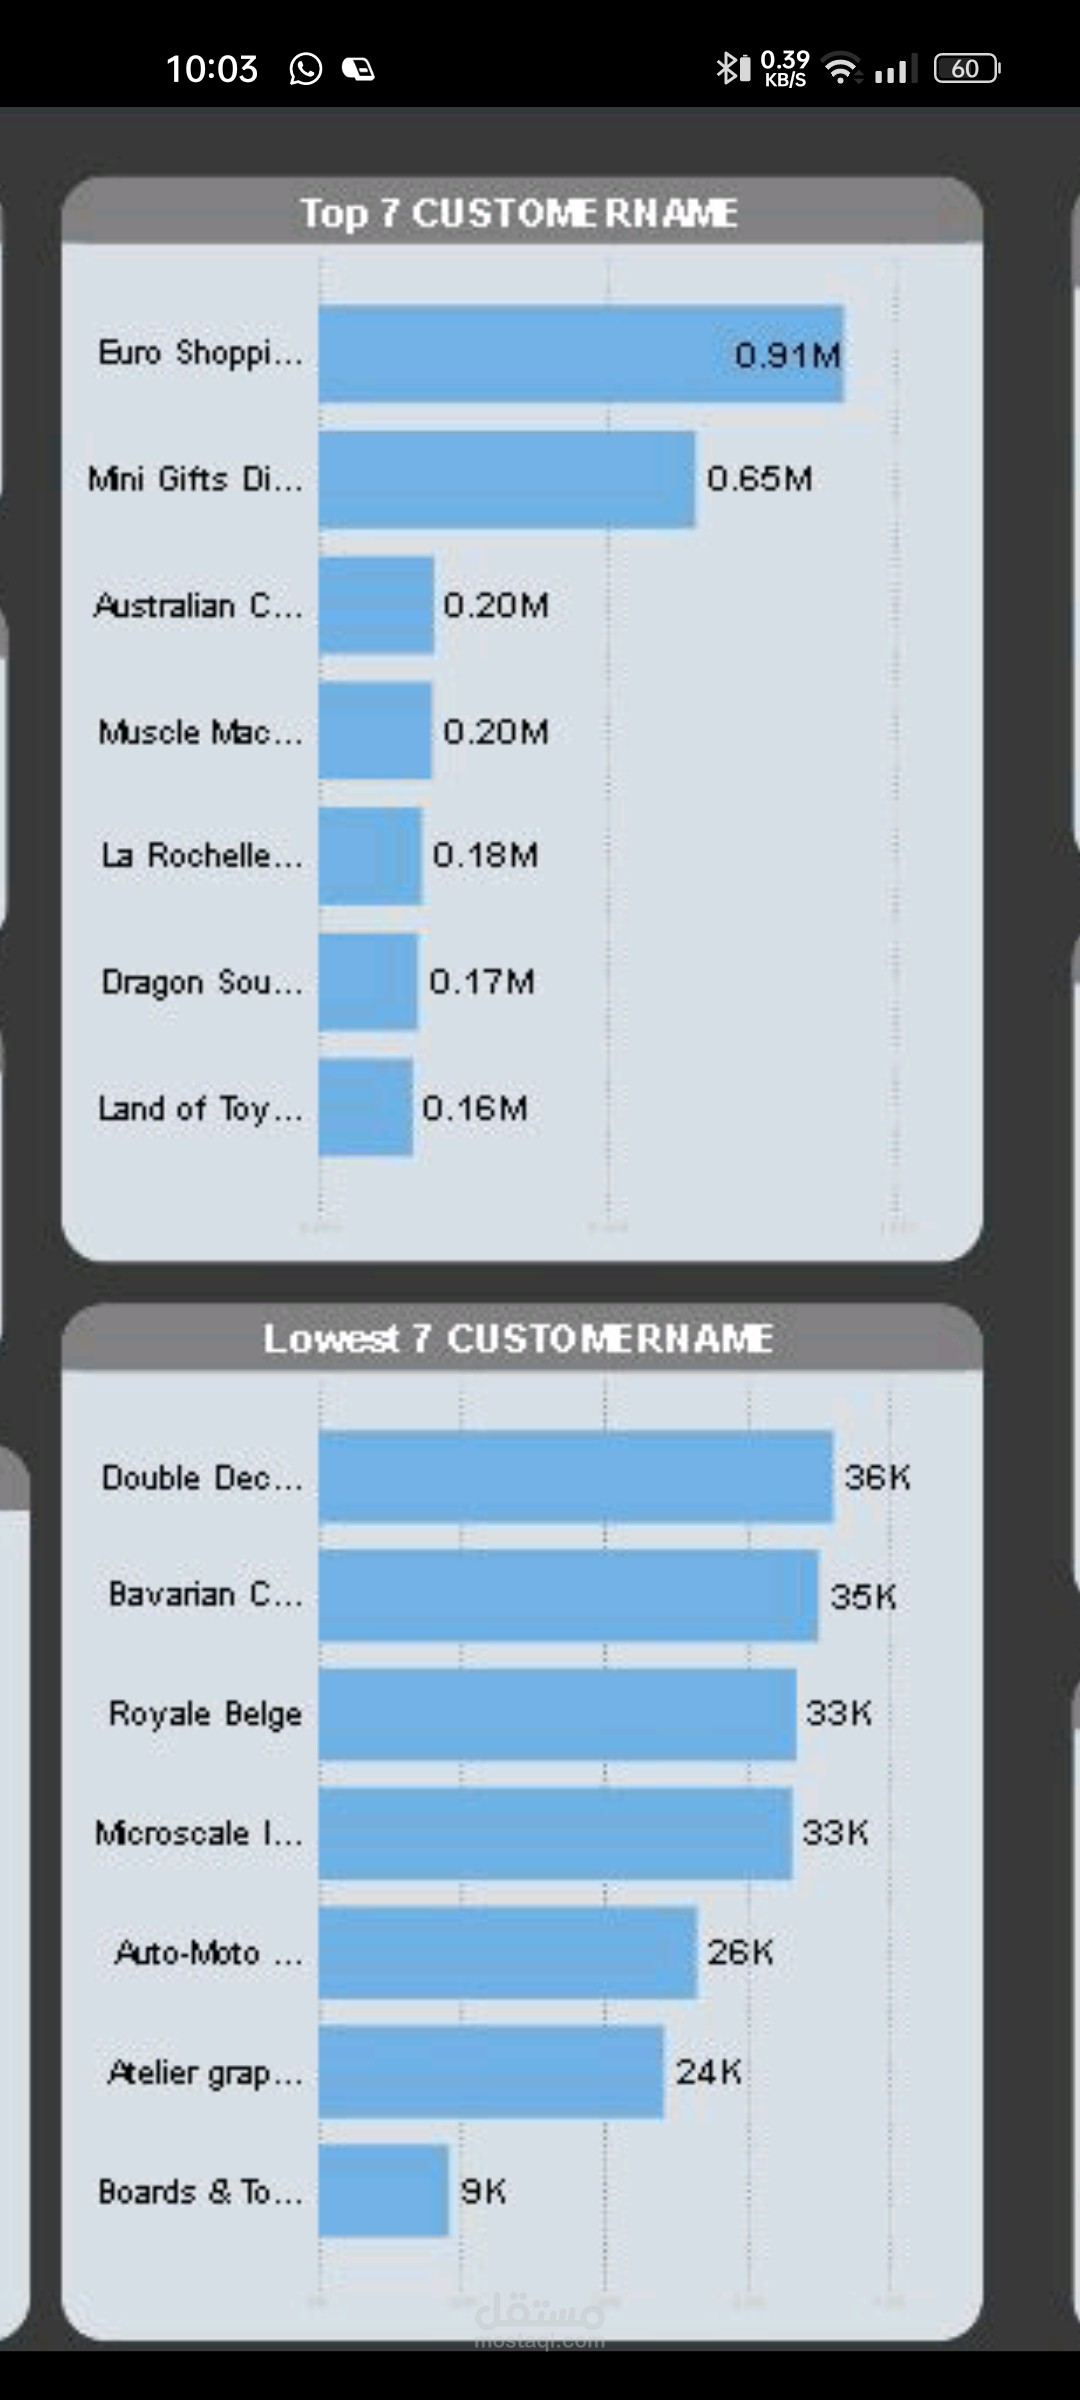
Top Customers: Euro Shopping Channel ($0.91M) and Mini Gifts Distributors ($0.65M) led the sales contribution.
Lowest Customers: Several buyers recorded sales under $40K, highlighting potential churn or low engagement.
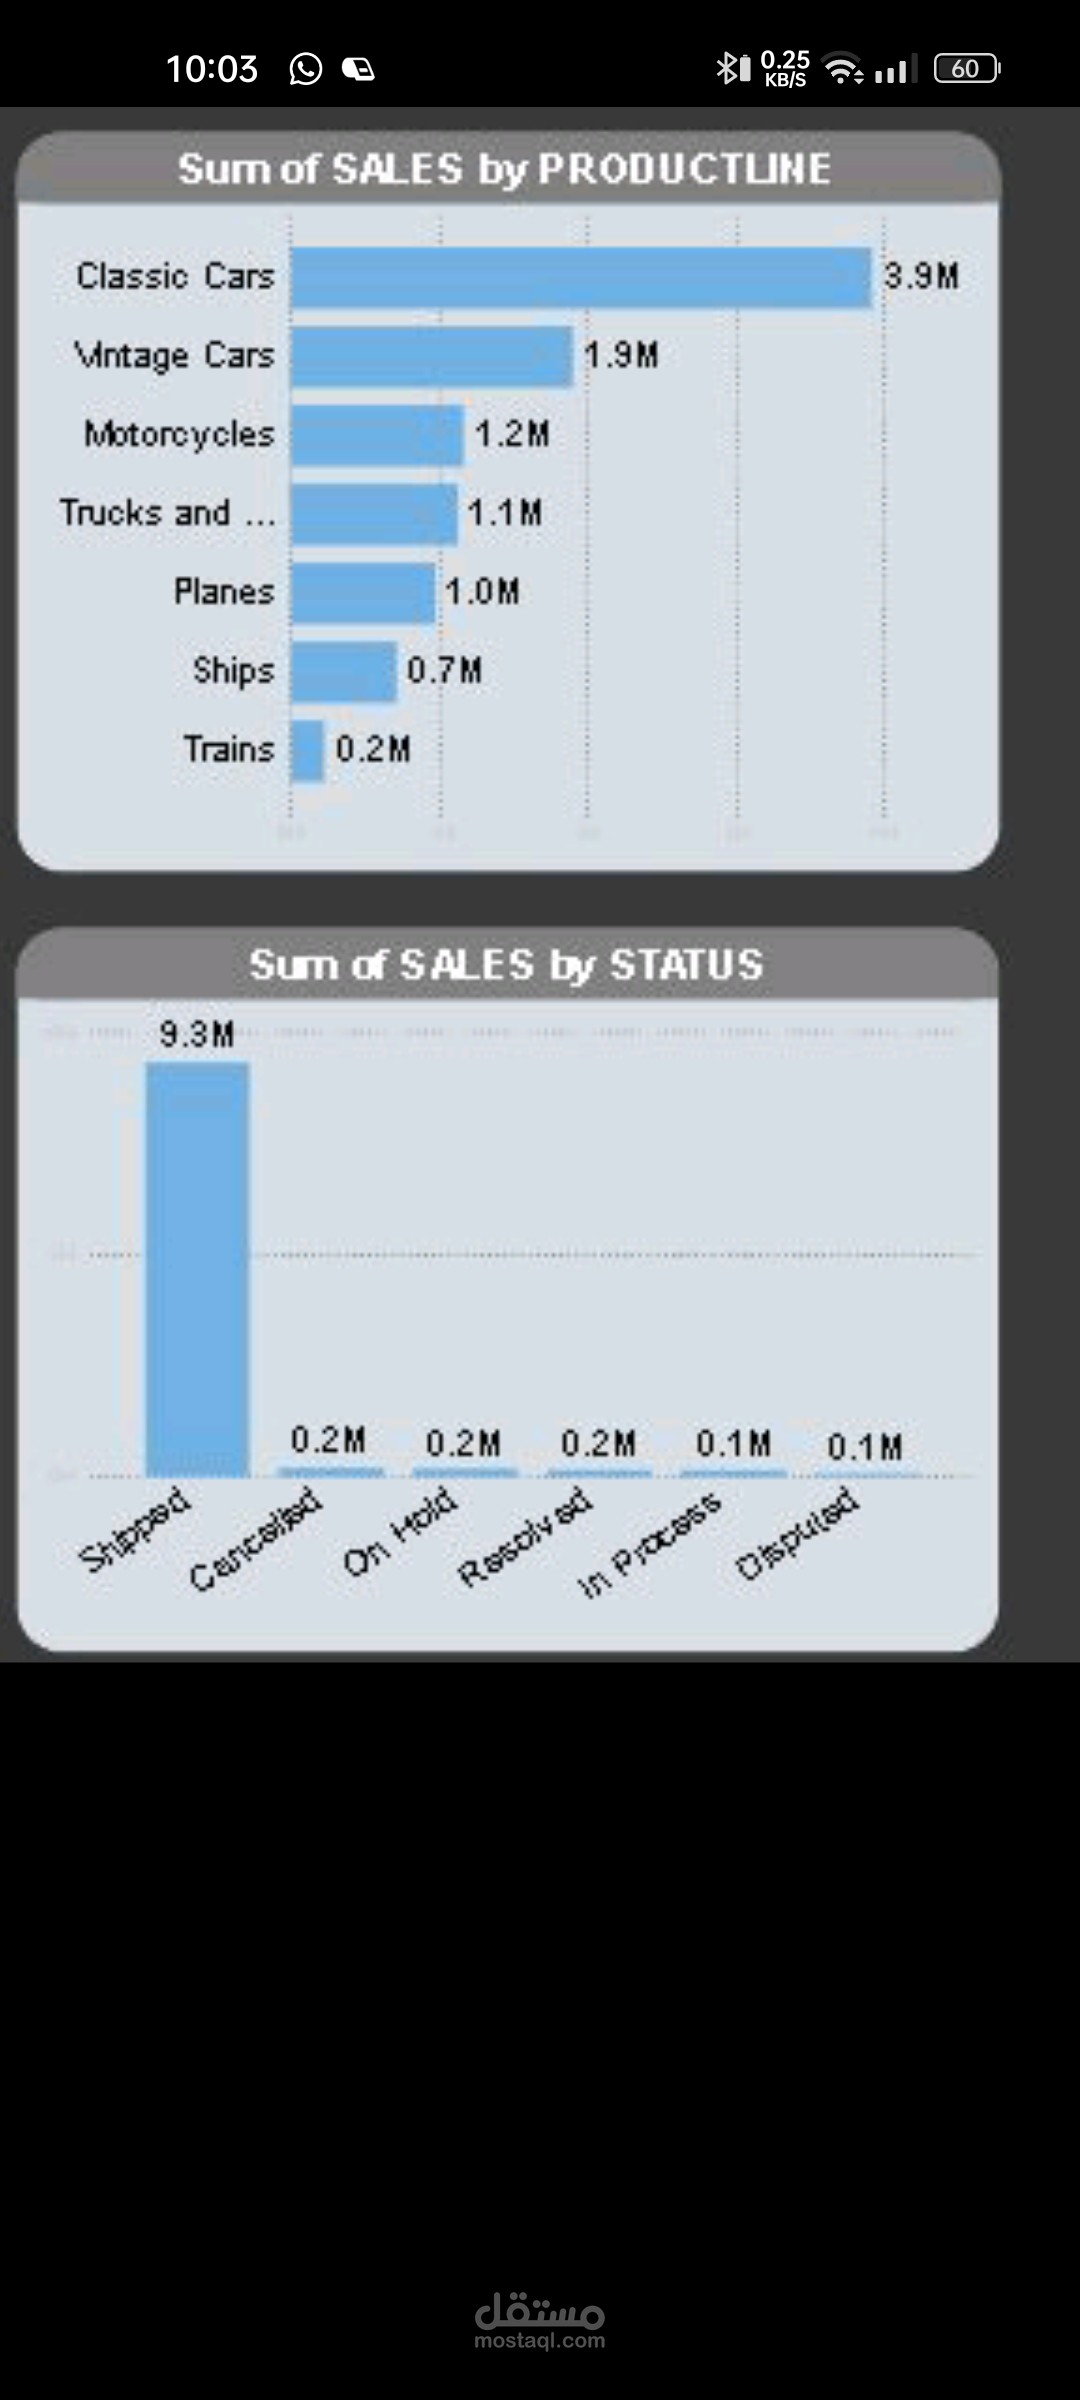
Product Lines: Classic Cars dominated with $3.8M, followed by Vintage Cars ($1.5M) and Motorcycles ($1.2M).
Deal Size Impact: Large deals represented 60.68% of revenue, showing the significant role of bulk transactions in driving performance.
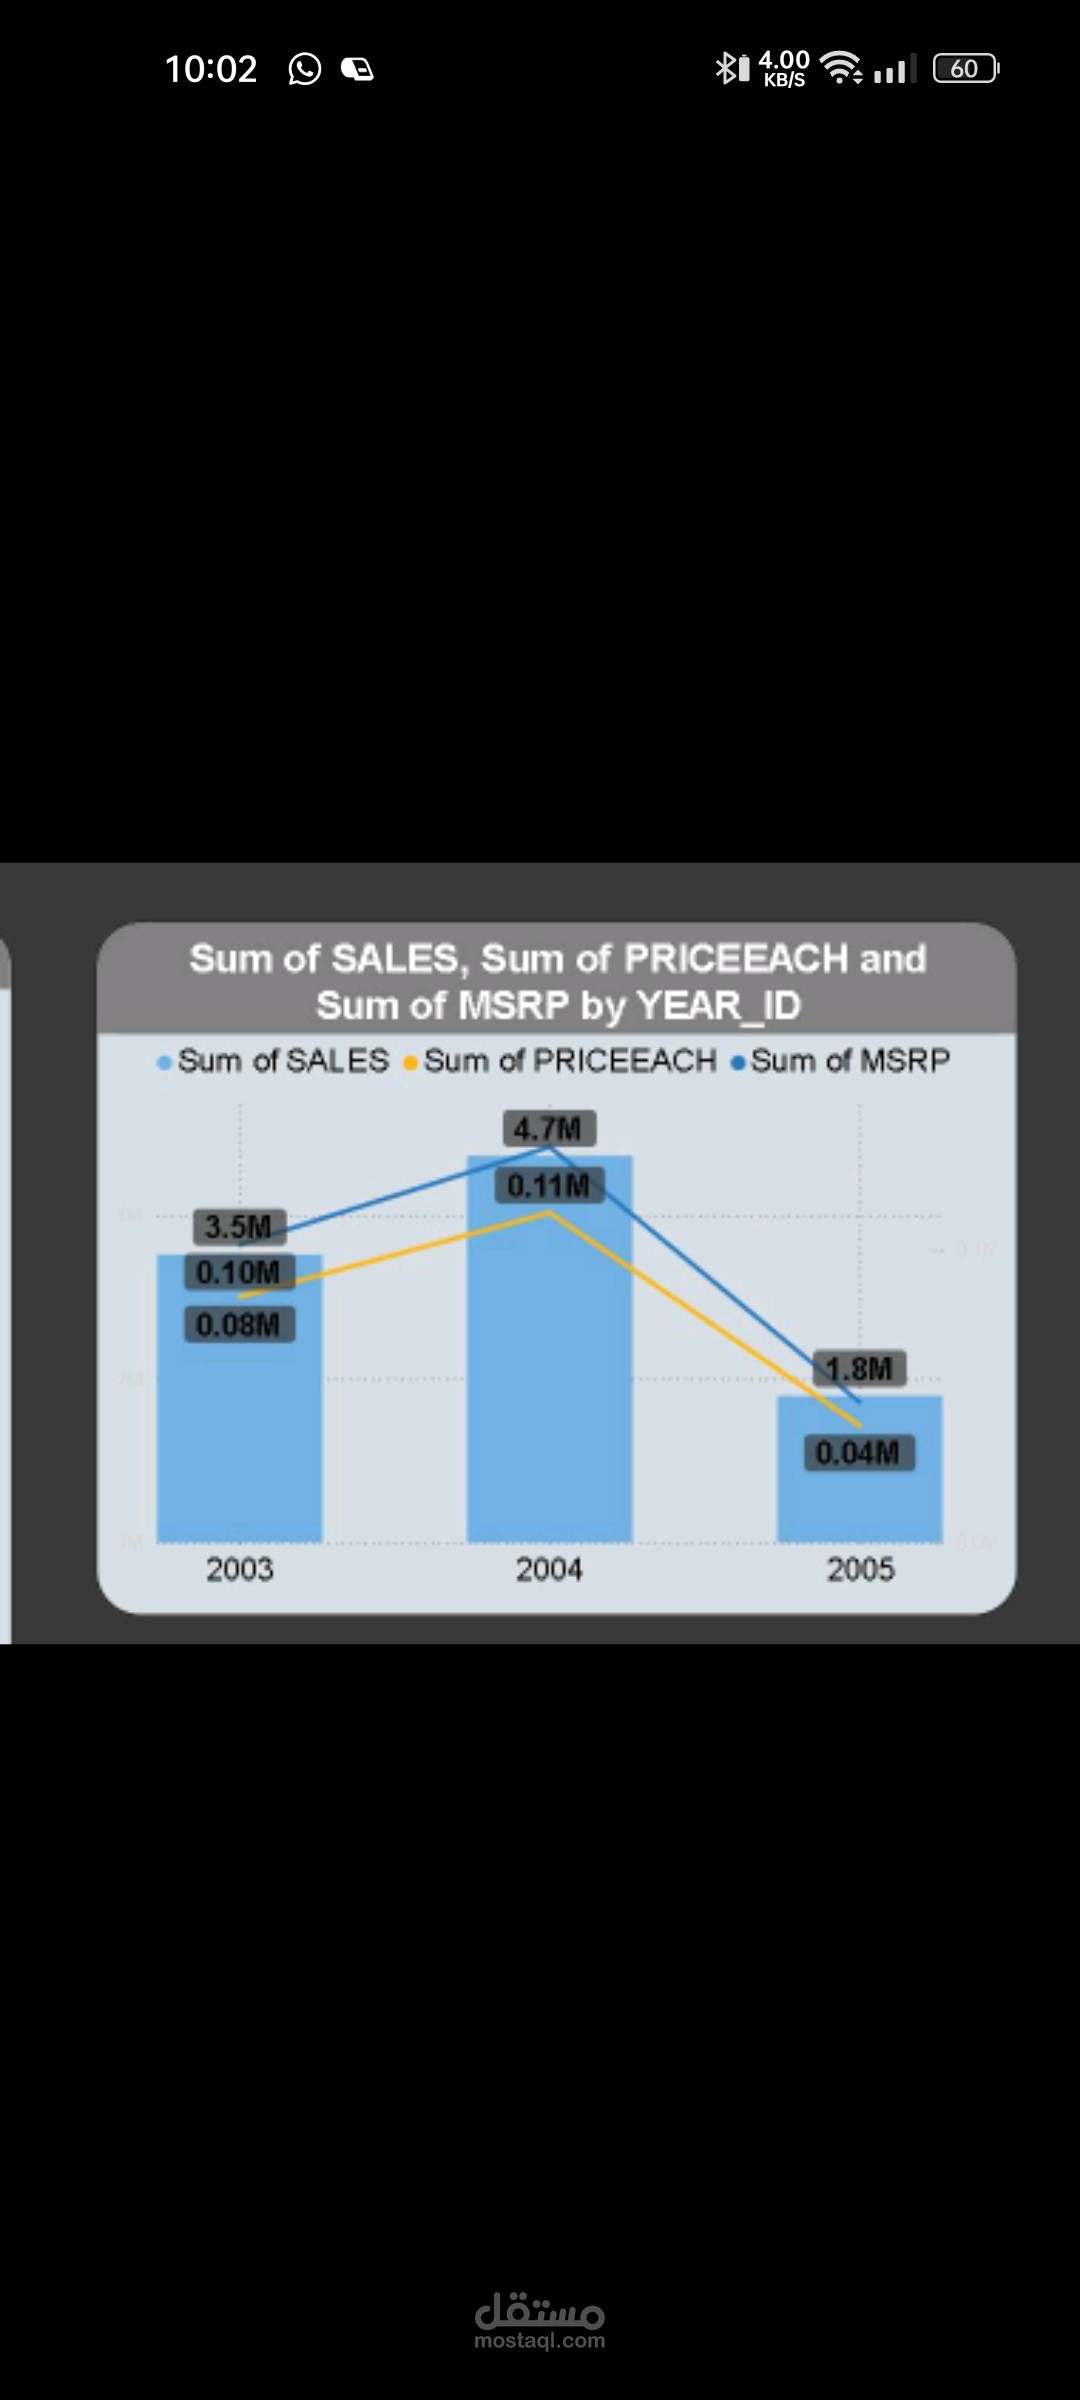
Yearly Trends: Sales peaked in 2004, before experiencing a sharp decline in 2005, signaling possible pricing or market dynamics challenges.
Order Status: The majority of orders were successfully Shipped, but cancellations and disputes also appeared, pointing to areas for operational improvement.
This analysis demonstrates how pricing strategies and deal sizes directly affect revenue streams, while also emphasizing the importance of understanding customer behavior and product line performance over time.