داش بورد
تفاصيل العمل

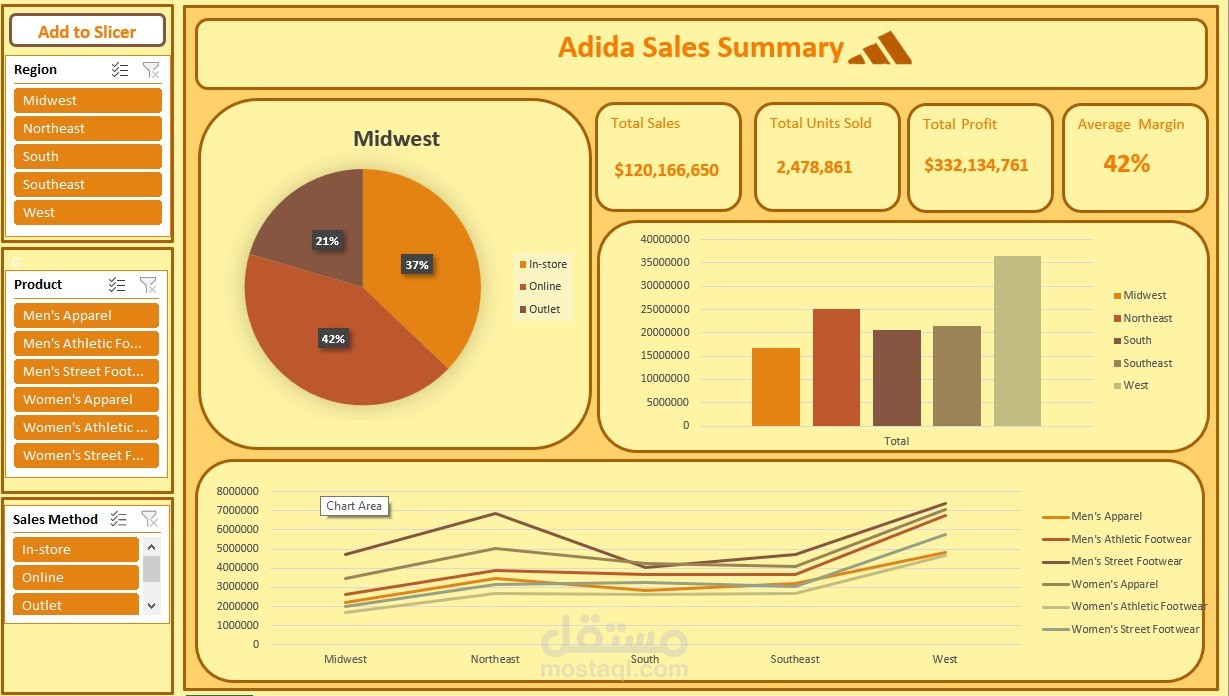
designed an interactive dashboard using Excel, providing a comprehensive analytical view of sales performance across five major regions during the period from 2020 to 2021. Here are the key insights:
Number of Products: 6
Brand: Adidas
Time Period: 2020 - 2021
Key Insights:
• The West region recorded the highest total sales.
• The most sold product throughout most of the year was Men’s street foot.
• The highest online sales were observed in the Southeast region.
• Northeast led in In-store sales.
• The highest Outlet sales came from the South region.
Tools Used:
Power Pivot, Pivot Charts, KPIs, Slicers, Interactive Dashboards – All in Excel.
This project helped me strengthen my skills in working with real-world data and extracting valuable insights to support decision-making.