Sales performance Dashboard Using Excel
تفاصيل العمل
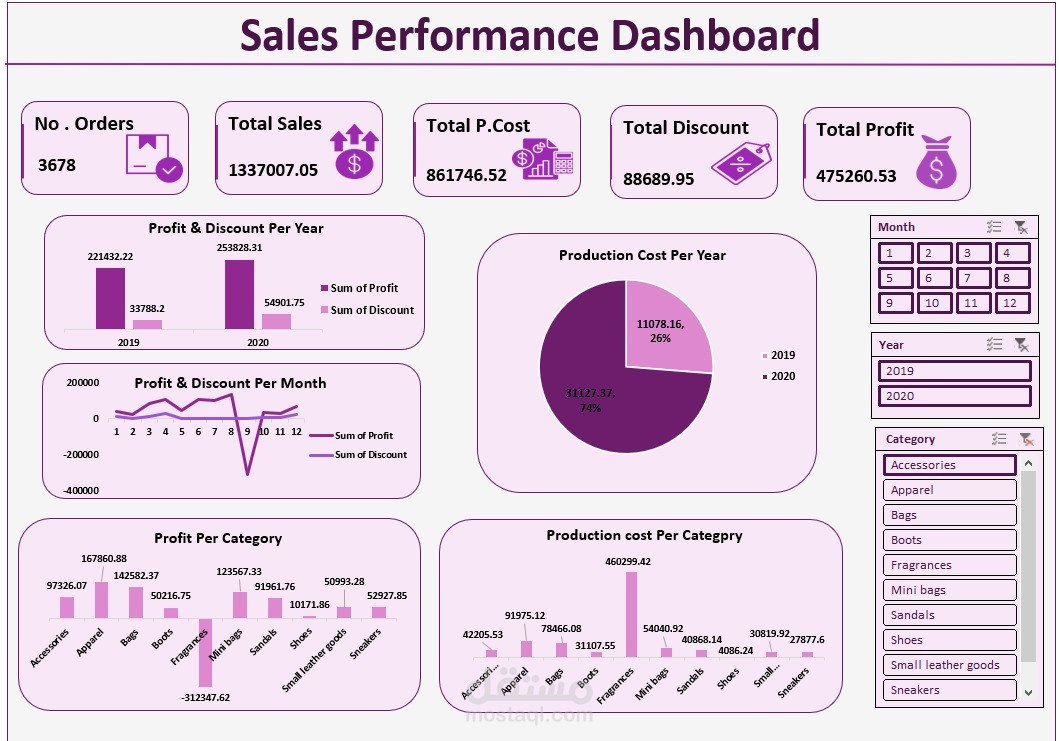
This dashboard was developed in Excel to analyze sales performance for different product categories and years. It showcases key business metrics such as total sales, profit, production cost, and discounts. Using Pivot Tables, charts, and slicers, the dashboard provides interactive filtering by month, year, and category. It helps businesses track trends, monitor KPIs, and identify opportunities to reduce costs and maximize profit.