MISUO SALES DASHBOARD
تفاصيل العمل

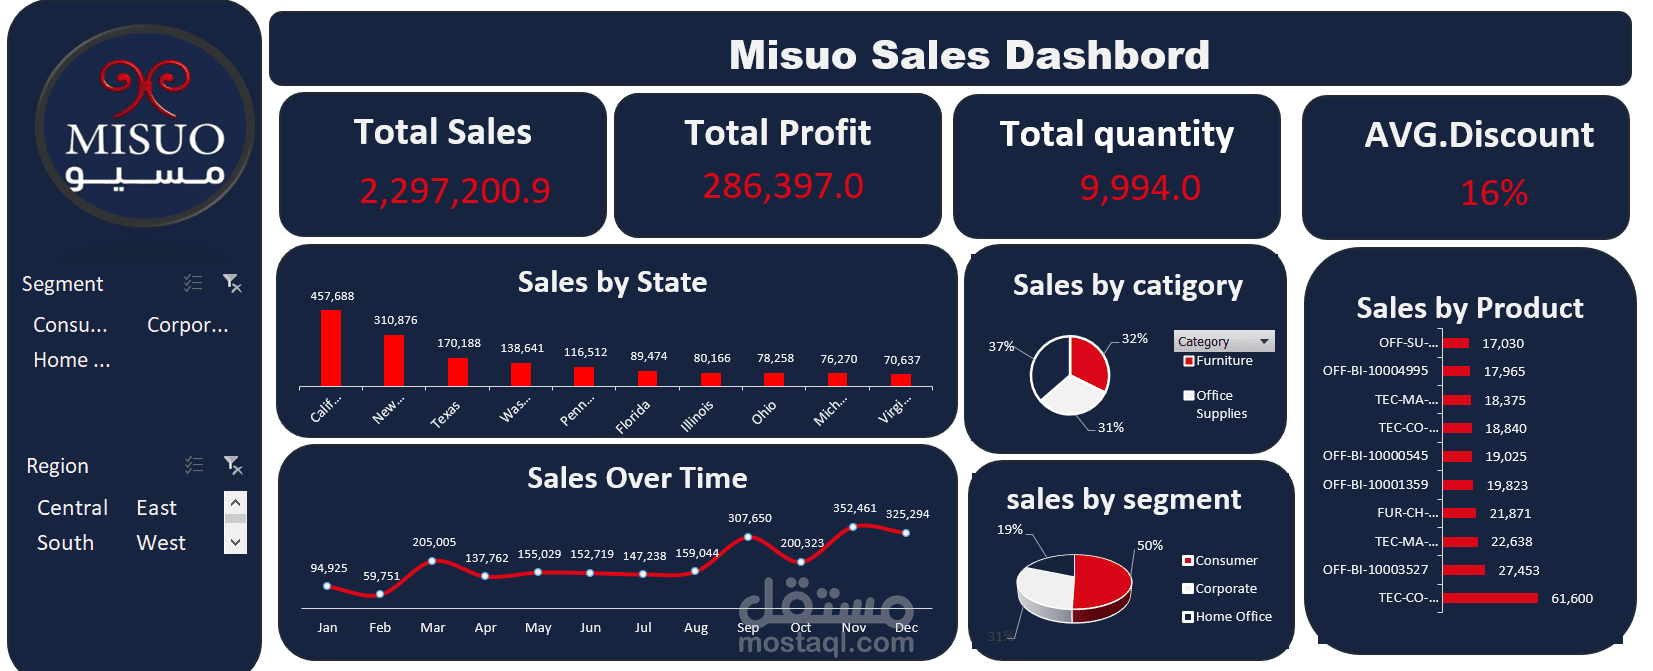
This project is a **Sales Dashboard** for MISUO, developed using **Microsoft Excel** for visualization and **Python** for data cleaning and preprocessing.
**Type of Work:**
A business intelligence and data analysis dashboard designed to provide a comprehensive view of MISUO’s sales performance.
**Key Features:**
* KPIs: *Total Sales, Total Profit, Total Quantity,* and *Average Discount*.
* Sales analysis by **state, category, product, and customer segment**.
* Monthly trend tracking to identify growth patterns and seasonal changes.
* Clear, interactive visualizations that support management decisions.
**Skills Highlighted:**
This project demonstrates my ability to combine **data cleaning with Python**, build **advanced Excel dashboards**, and apply a strong **business understanding** to transform raw data into actionable insights that drive better decision-making.