Regional Sales Dashboard
تفاصيل العمل
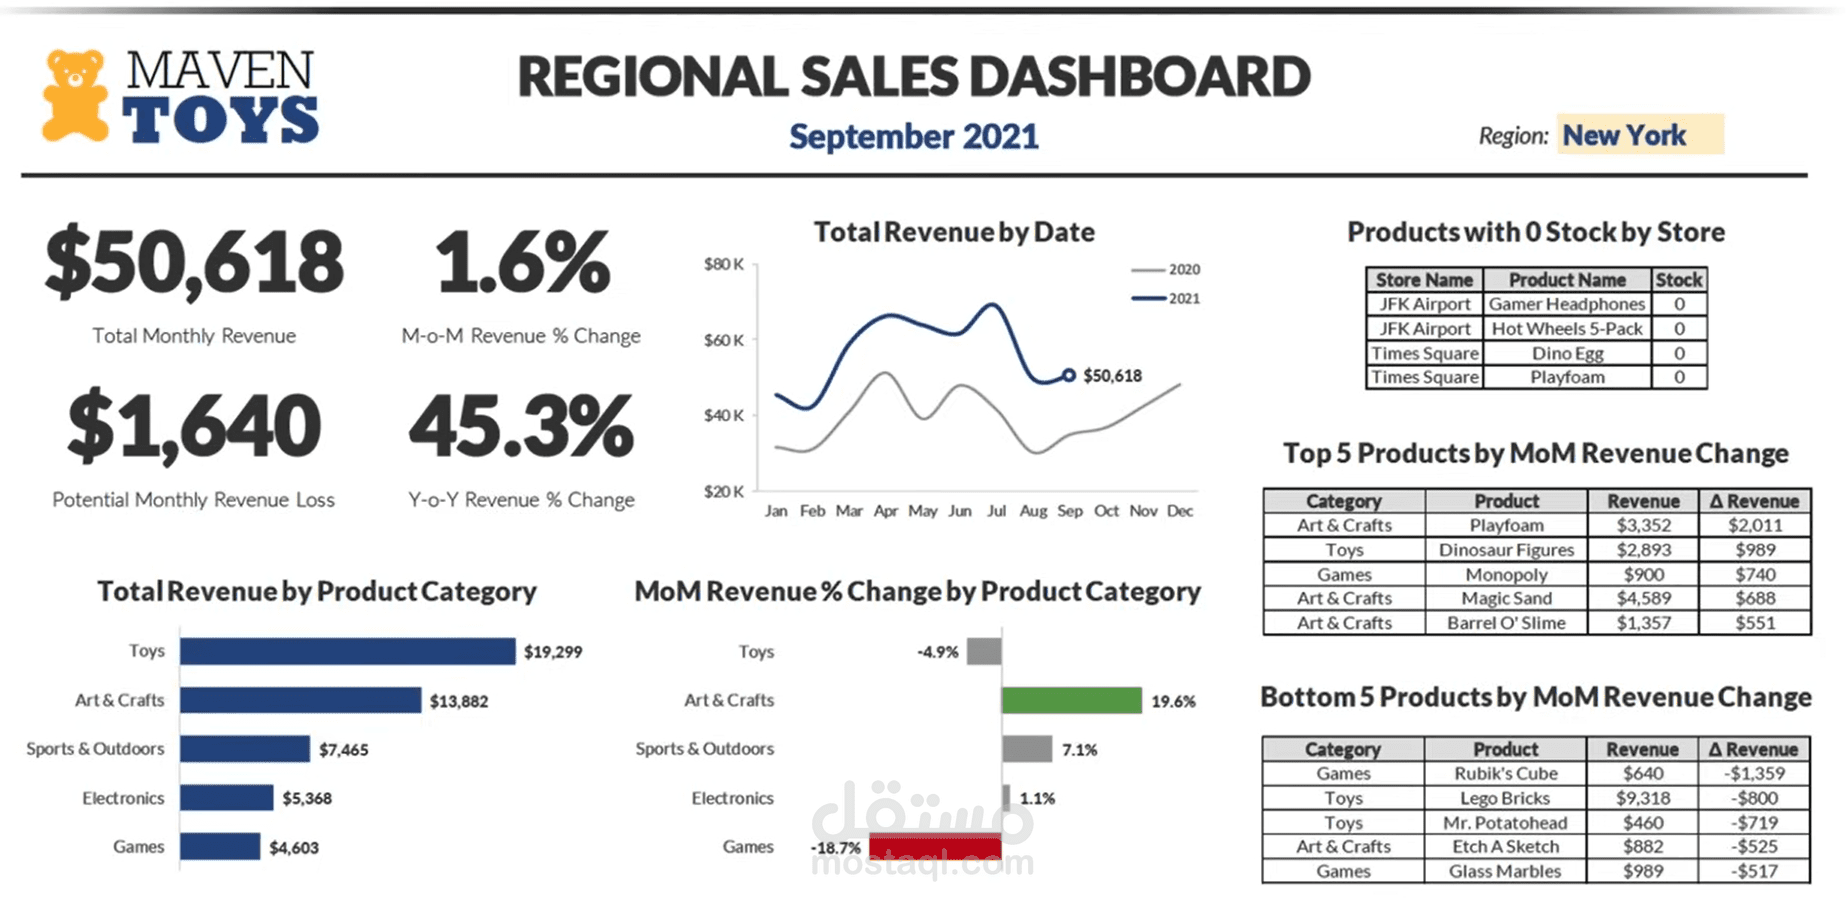
An interactive Excel dashboard that tracks and analyzes regional sales performance for a retail toy company.
Key Features: Presents key KPIs including total monthly revenue, month-over-month (MoM) and year-over-year (YoY) revenue change, and potential revenue loss.
Visual Insights: Dynamic charts highlight total revenue by product category, MoM revenue change by category, and revenue trends over time. Tables identify products with zero stock, as well as the top and bottom performers by MoM revenue change.
Tools Used: Microsoft Excel (Power Query, Pivot Tables, Conditional Formatting, and Interactive Charts).
Impact: Provides a clear snapshot of sales performance, enabling management to quickly spot trends, address stock shortages, and make data-driven decisions to increase revenue.