Data Science Salary Dashboard
تفاصيل العمل
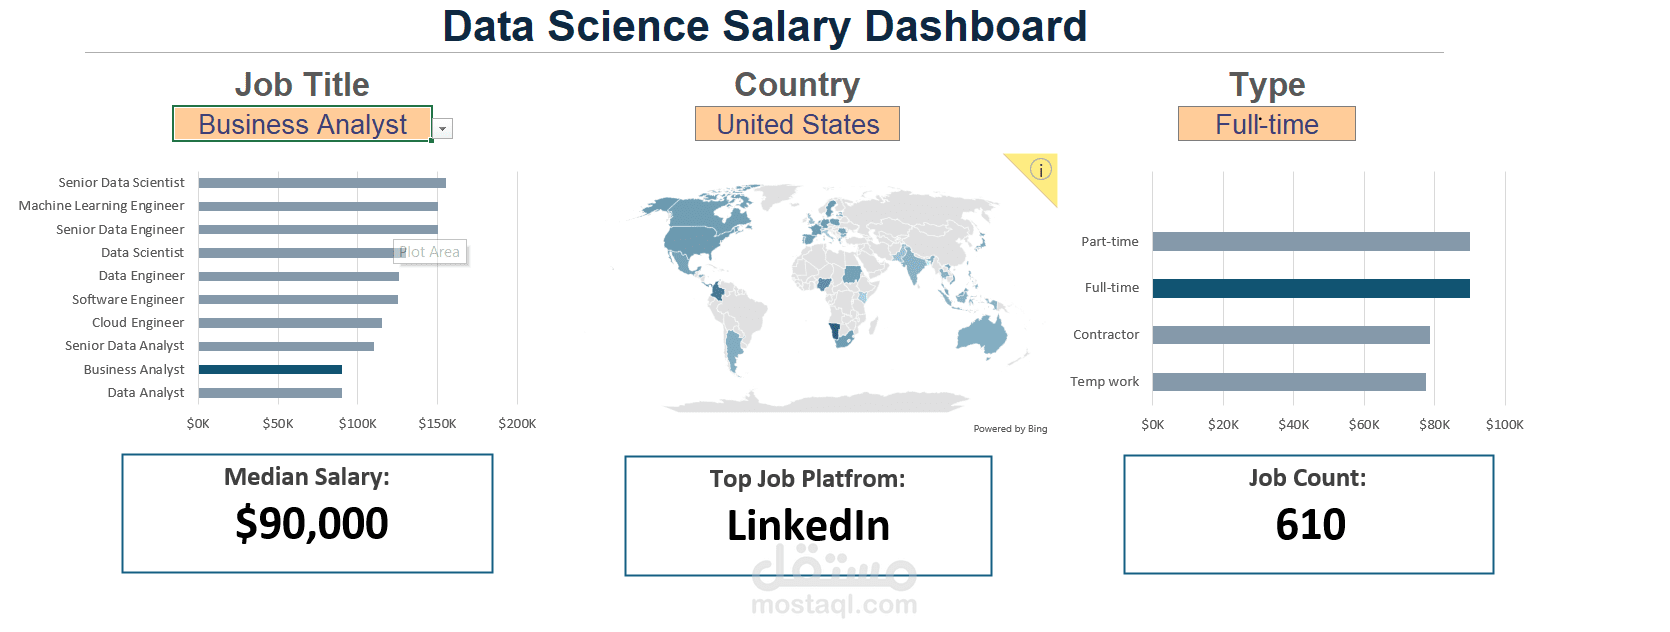
An interactive Excel dashboard designed to analyze and visualize data science salary trends across different job roles, countries, and employment types.
Key Features: Dynamic filters for Job Title, Country, and Employment Type allow users to explore salaries with ease.
Visual Insights: Displays median salary, job count, and top job platform alongside global salary distributions using charts and a world map.
Tools Used: Microsoft Excel (Power Query, Pivot Tables, Slicers, and Interactive Charts).
Impact: Helps job seekers and recruiters quickly compare salaries, identify top hiring platforms, and make informed career or hiring decisions.