Urban Energy Generation and Efficiency dashboard
تفاصيل العمل
Overview
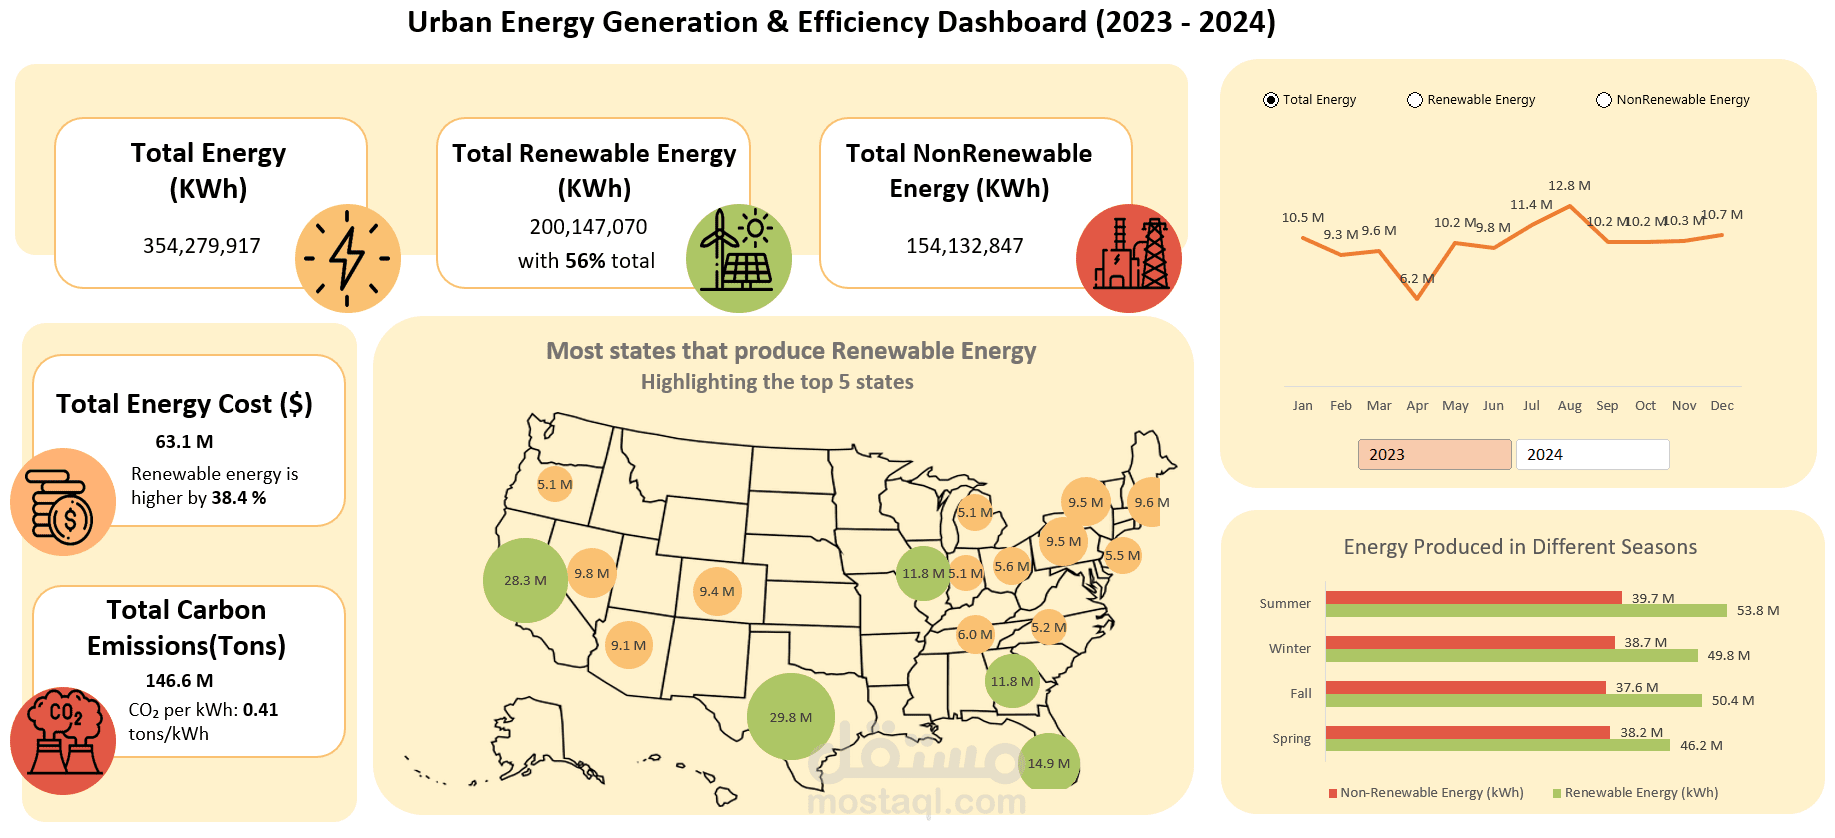
Designed and developed a dynamic Energy Analytics Dashboard to track renewable vs. non-renewable energy generation across major U.S. cities for the years 2023–2024.
The project demonstrates advanced Excel data analytics capabilities, from data cleaning to modeling and visualization, turning raw CSV files into actionable sustainability insights.
Key Objectives
Consolidate and analyze 24 monthly CSV datasets containing city-level energy data.
Provide clear, interactive insights on renewable energy share, carbon emissions, and cost efficiency.
Highlight top-performing cities and trends to support sustainability decision-making.
Process & Deliverables
️ Data Cleaning & Preparation – Fixed spelling inconsistencies, standardized location names for mapping, handled missing/null values, and removed duplicates.
️ Data Transformation – Appended 24 CSV files, added Month and Year columns, and created calculated fields (Total Energy, % Renewable Share, Cost per kWh, CO₂ per kWh).
️ Data Modeling – Built efficient relationships and measures in Power Pivot using DAX for KPIs and aggregated calculations.
️ Dashboard Design – Delivered a professional Excel dashboard with interactive charts, KPI cards, and maps to visualize renewable vs. non-renewable production trends.
Key Insights
Renewables supplied 56% of total energy, outpacing non-renewables by 38.4%.
Each kWh produced emitted approximately 0.41 tons of CO₂.
Top renewable producers: Texas, California, Florida, Georgia, and Illinois.
Tools & Skills
Excel (Power Query, Power Pivot, DAX)
Data Cleaning & Transformation
Data Modeling & KPI Development
Dashboard & Data Visualization