Interactive HR Dashboard
تفاصيل العمل
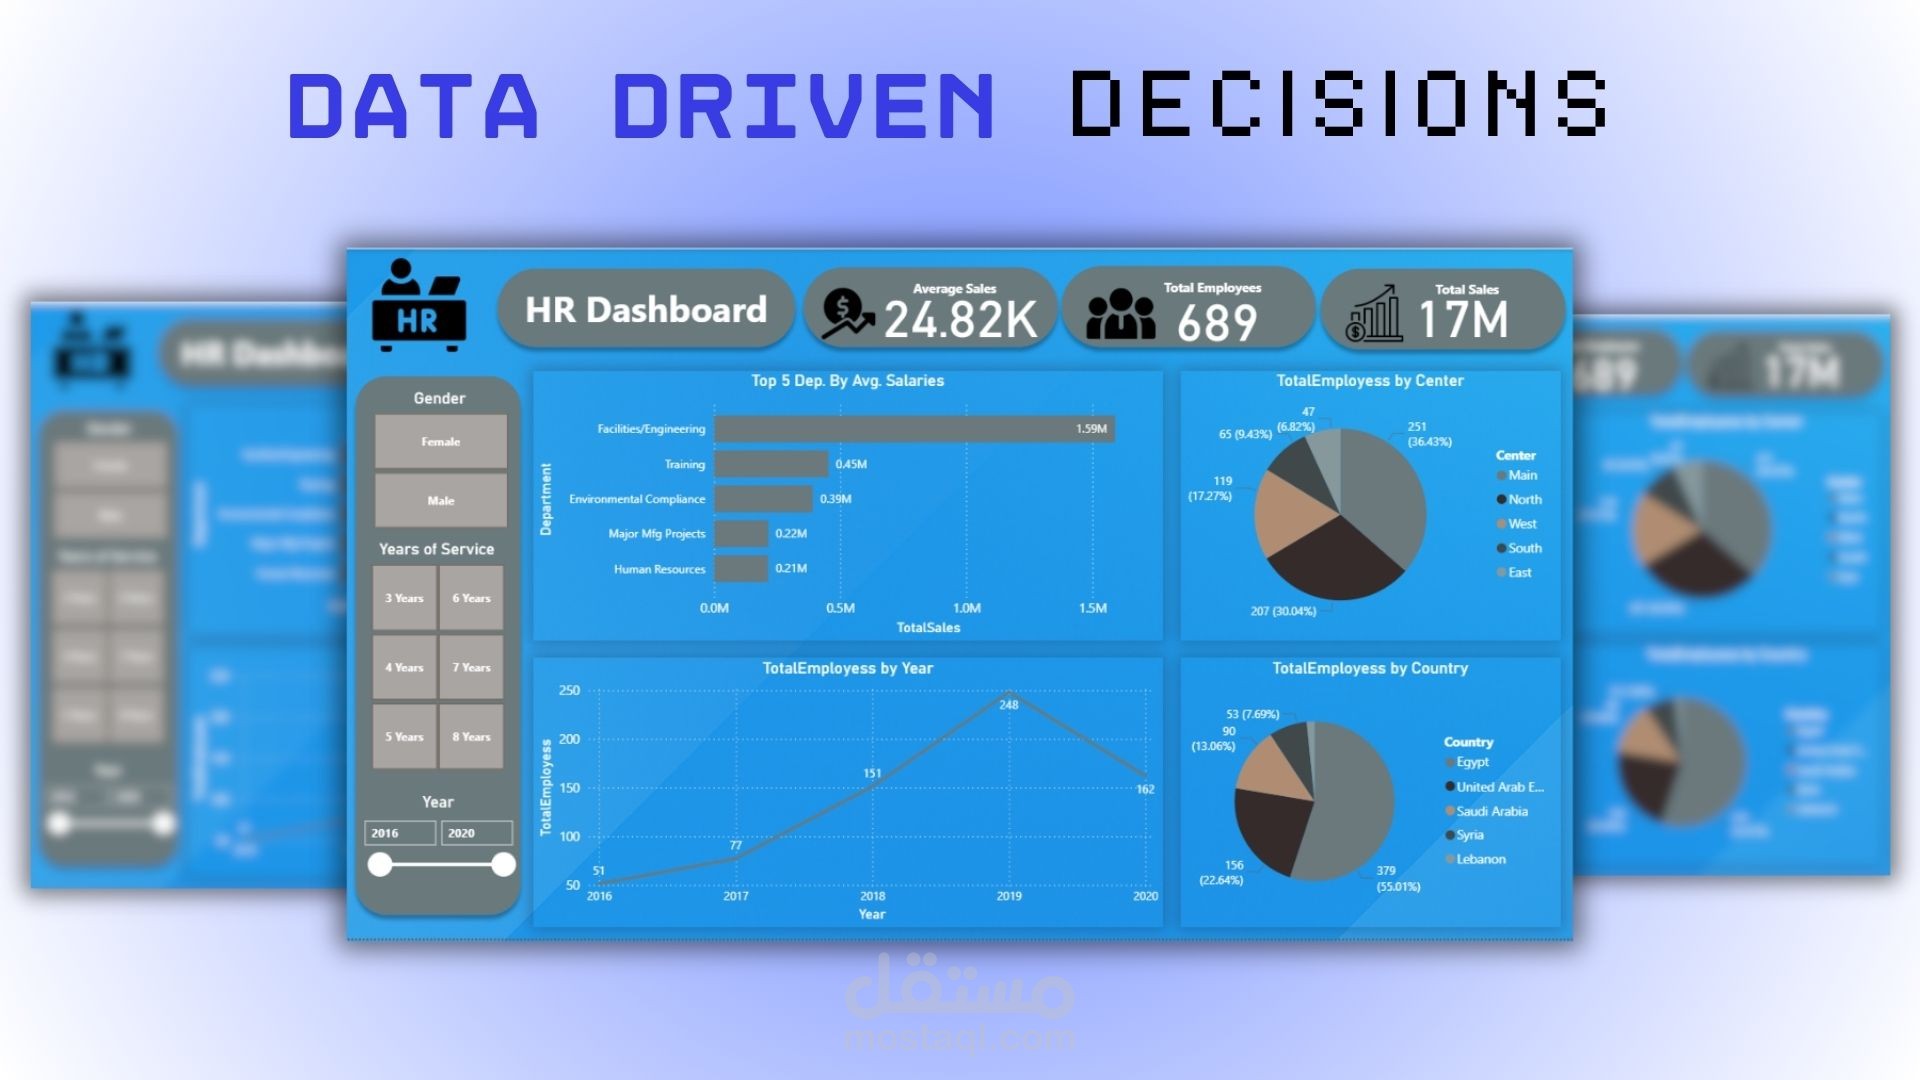
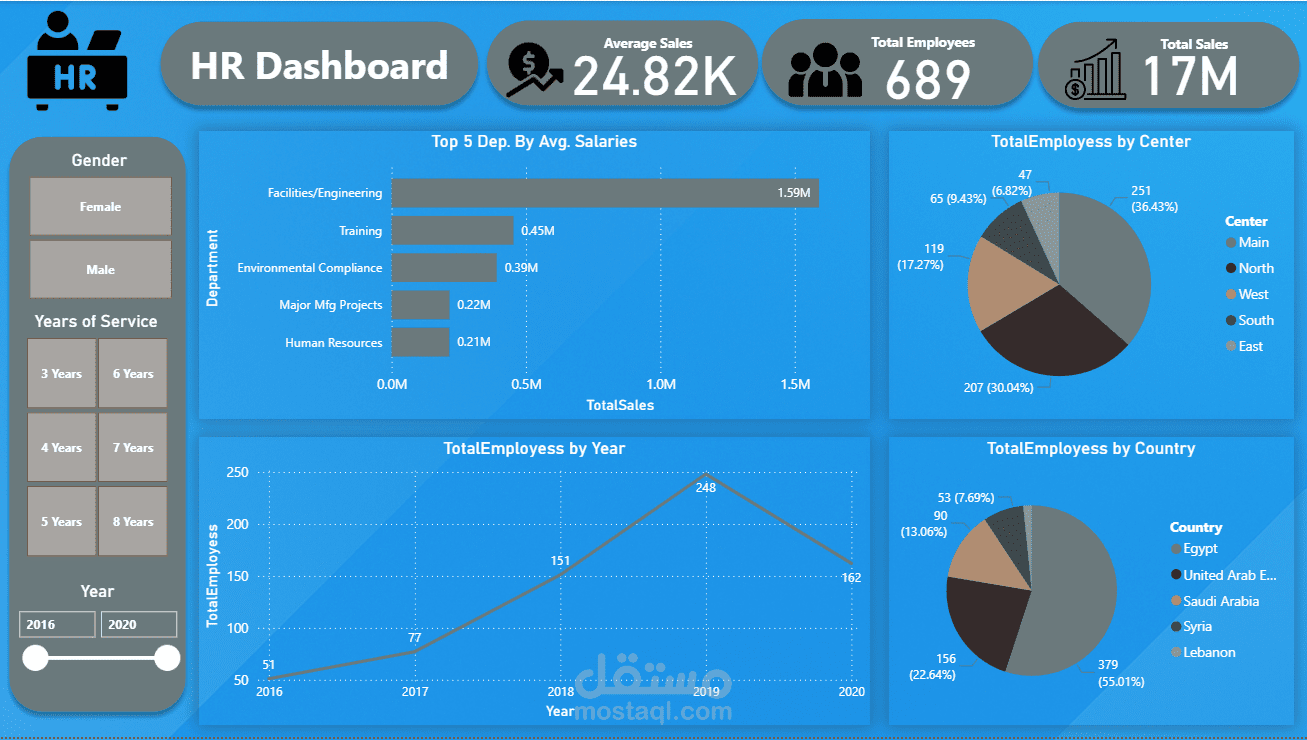
هل دي داشبورد HR ولا مبيعات؟ تعالوا نكتشف السر ورا الأرقام دي!
مش داشبورد HR (موارد بشرية) تقليدية؛ دي رابطة بين الموظفين والفلوس (المبيعات)! ده بيسموه في البيزنس قياس الـ (Revenue per Employee).
تعالوا نقرأ الأرقام دي بتقول إيه:
الخلاصة من فوق (موظفين وفلوس): الشركة دي حجمها متوسط، فيها 689 موظف. المثير للاهتمام إن الداشبورد بتقول إن إجمالي المبيعات (Total Sales) وصل لـ 17 مليون، بمتوسط 24.8 ألف! يعني الإدارة هنا عينها على إنتاجية الموظفين بتترجم لكام في المبيعات.
لغز الرواتب والمبيعات: الرسمة اللي فوق على الشمال فيها "تريكاية" أو يمكن غلطة من المصمم ؛ العنوان بيقول "أعلى 5 أقسام حسب متوسط الرواتب"، بس المحور اللي تحت مكتوب عليه "إجمالي المبيعات"! وفي الحالتين، قسم "المرافق والهندسة" (Facilities/Engineering) هو اللي واكل الجو ومستحوذ على أعلى رقم (1.59 مليون)، يليه قسم التدريب.
الموظفين متوزعين فين؟ (رسومات الدونات):
جغرافياً: لو بصينا على الدول، هنلاقي إن القوة الضاربة للشركة دي في مصر (أكتر من 55% من الموظفين)، وبعدين الإمارات بنسبة 22.6%، وبعدين السعودية.
حسب الفروع: الفرع الرئيسي (Main) هو اللي فيه الزحمة الأكبر (حوالي 36%)، والفرع الشمالي (North) وراه على طول.
صدمة سنة 2020 (الخط الزمني): الرسمة اللي تحت على الشمال بتوريك "تريند" التوظيف. الشركة كانت بتكبر بسرعة صاروخية من 2016 ووصلت للقمة في 2019 (بـ 248 موظف جديد أو إجمالي الموظفين في السنة دي)، بس هوب.. في 2020 الكيرف نزل فجأة لـ 162! وده منطقي جداً وبيحكي قصة تأثير أزمة كورونا (COVID-19) على التوظيف وتسريح العمالة في الوقت ده.
الفلاتر: على الشمال خالص في فلاتر بسيطة عشان تقدر تفلتر البيانات دي حسب النوع (ذكر/أنثى)، أو سنين الخبرة، أو تختار سنة معينة.
Overview:
Interestingly, while it's titled an "HR Dashboard," it heavily incorporates Sales metrics. This is a great example of a hybrid dashboard that tries to link workforce capacity directly to revenue generation.
Here is the story the data tells us:
The Big Picture (KPIs): The top ribbon shows a workforce of 689 Total Employees. However, it sits right next to a "Total Sales" figure of 17M and an "Average Sales" of 24.82K. This setup is designed to show stakeholders the direct financial output of their human capital.
The "Quirky" Bar Chart: The top-left chart has an interesting contradiction. The title says "Top 5 Dep. By Avg. Salaries", but the X-axis tracks "TotalSales". Either way, the Facilities/Engineering department is by far the heaviest hitter, accounting for 1.59M, leaving Training and HR far behind.
Workforce Demographics (Pie Charts): * By Country: The bottom-right chart shows that the company's workforce is heavily concentrated in Egypt, making up 55.01% of the total staff. The UAE comes in second at 22.64%.
By Center: Internally, the "Main" center and the "North" center hold the majority of the employees (combining for over 66%).
The 2020 Plunge (Trend Line): The bottom-left line chart tells a very realistic story. We see a steady and steep growth in employee numbers starting from 2016, peaking beautifully in 2019 at 248. However, there is a sharp drop in 2020 down to 162, which perfectly visualizes the global impact of the 2020 pandemic on hiring and layoffs.