The U.S. Flight Disruption Analyzer: A Data-Driven Dashboard for Optimizing Airline Performance and Operational Resilience
تفاصيل العمل

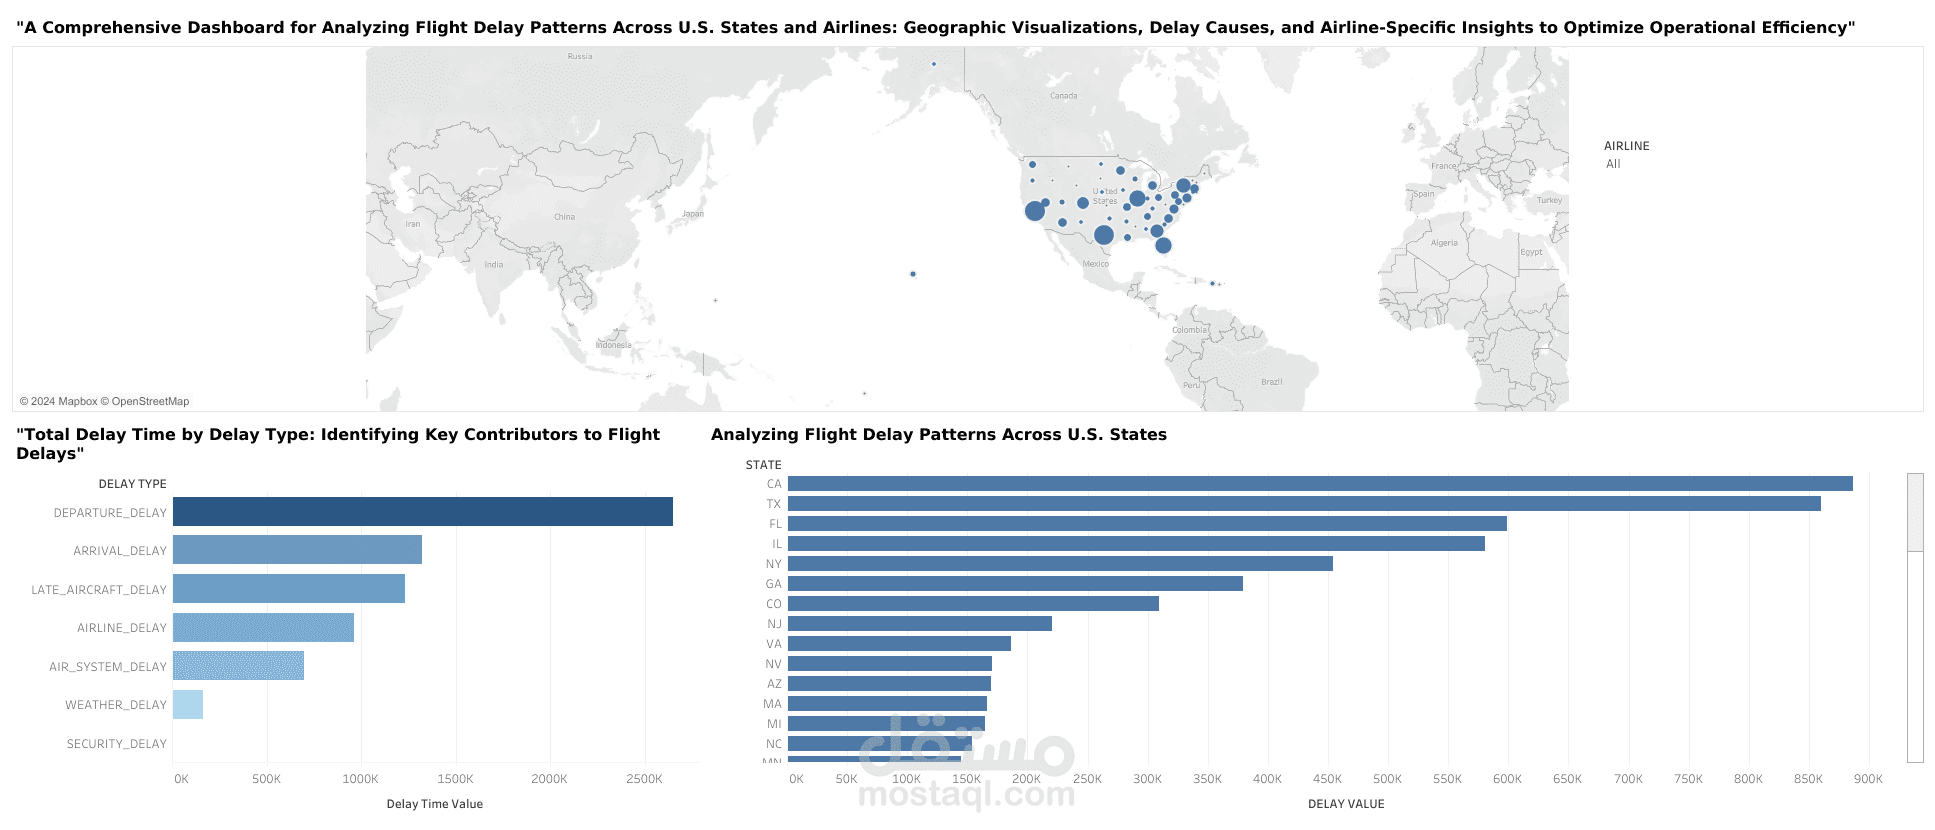
This project is a Flight Disruption Analysis Dashboard that provides key insights into U.S. airline performance. It helps identify operational inefficiencies by analyzing three main areas:
Delay Causes: It breaks down total delay times by type (e.g., aircraft issues, air system, weather) to pinpoint the biggest contributors to flight delays.
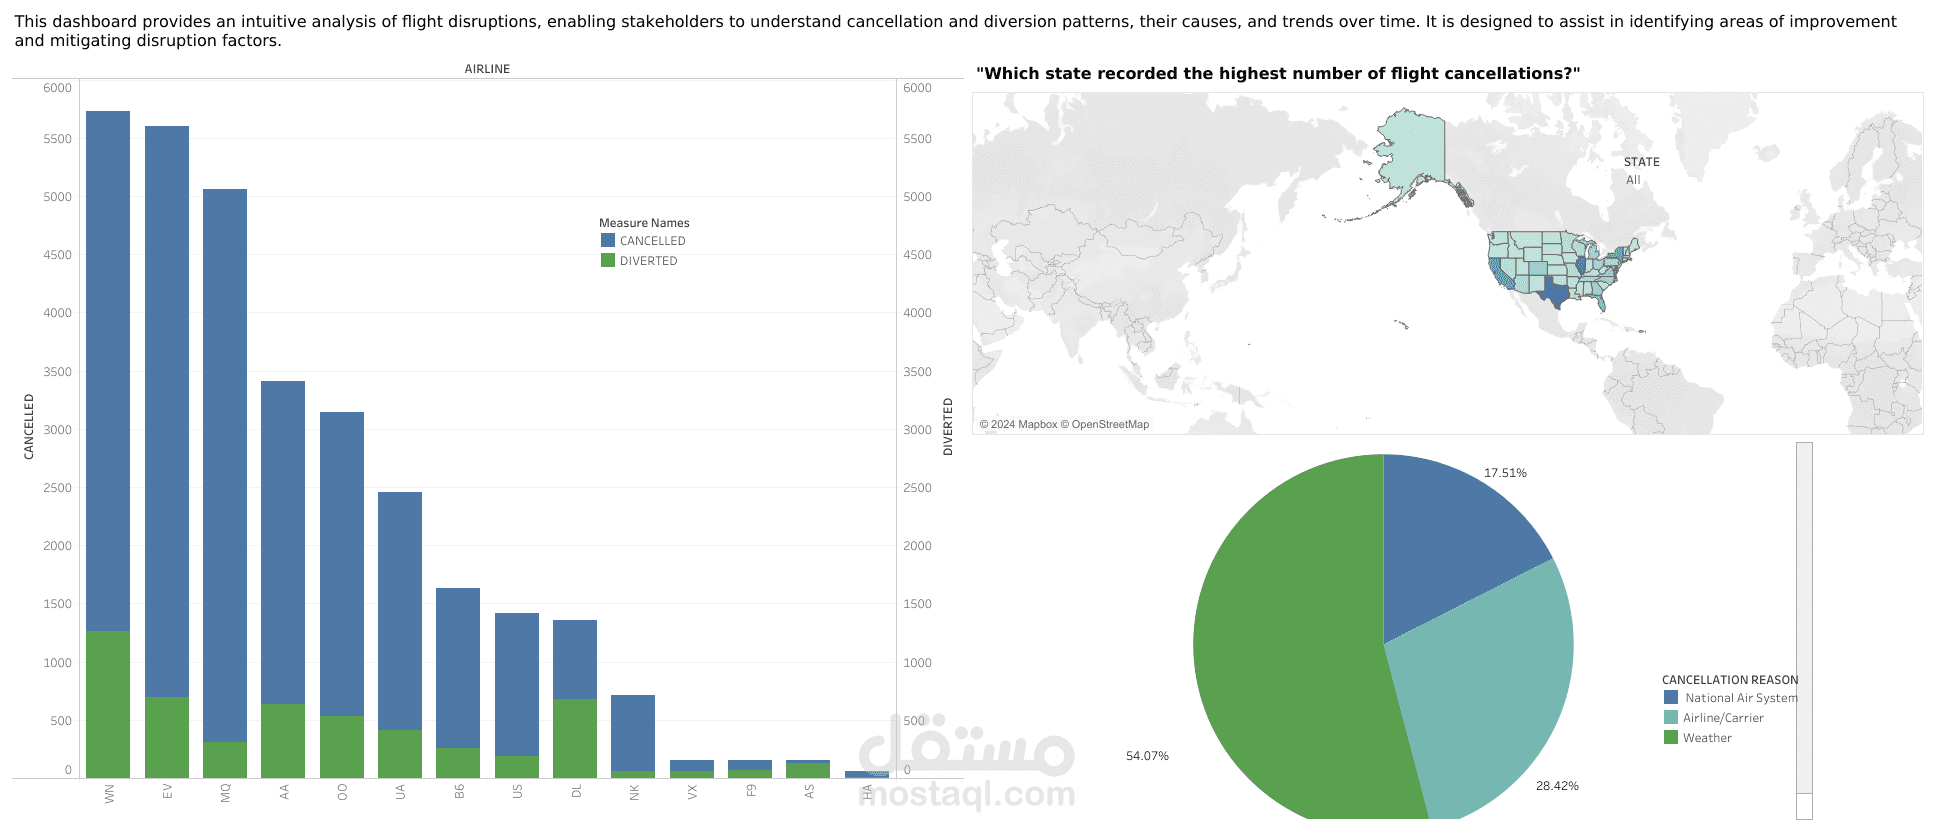
Cancellation Patterns: It tracks flight cancellations and diversions over time, highlighting the leading causes and identifying which U.S. states experience the most cancellations.
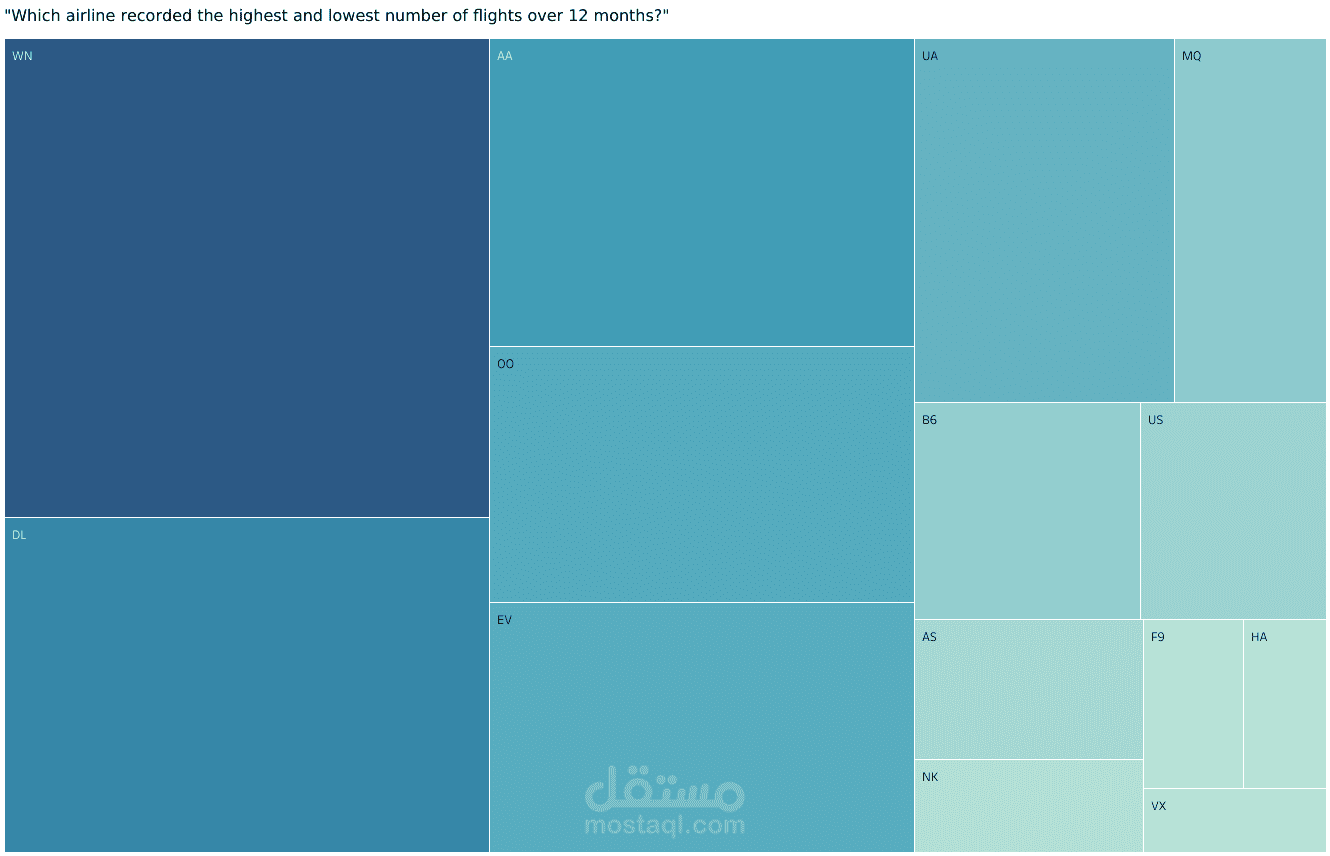
Airline Comparison: It benchmarks airlines against each other, showing which carriers operated the highest and lowest number of flights over a 12-month period.
In short, this dashboard turns complex flight data into clear, actionable insights to help airlines and airports reduce disruptions and improve operational efficiency.