Data Analysis Dashboard Excel
تفاصيل العمل
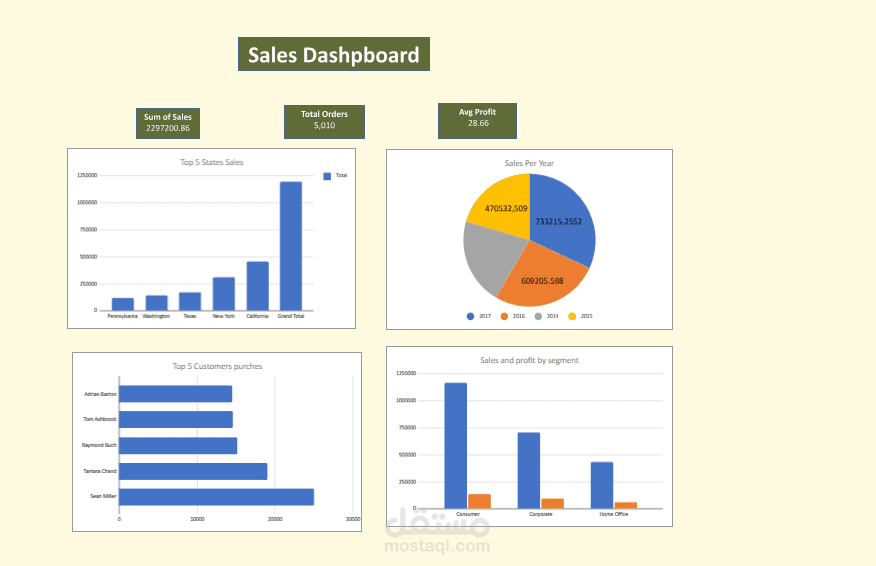

Project Goal:
Designed and developed an interactive dashboard in Excel to analyze and visualize business data, supporting decision-making and performance tracking.
Key Responsibilities & Tasks:
Collected, cleaned, and structured raw datasets for analysis.
Built PivotTables and PivotCharts to summarize KPIs.
Applied Power Query for automated data transformation and refreshing.
Used Power Pivot with DAX measures to create advanced calculations.
Designed interactive slicers, timelines, and drop-down filters for dynamic reporting.
Applied conditional formatting to highlight trends, risks, and outliers.
Developed a user-friendly dashboard layout with charts (bar, line, pie, stacked) and key performance metrics.
Ensured dashboard scalability for new data updates without breaking formulas.
Key Achievements:
Reduced manual reporting time by X% through automation.
Improved accuracy and consistency of insights with structured data models.
Enabled stakeholders to track sales, performance, and trends in real time.
Delivered a professional, visually appealing dashboard aligned with business needs.