Customer Churn Dashboard (Vodafone style)
تفاصيل العمل

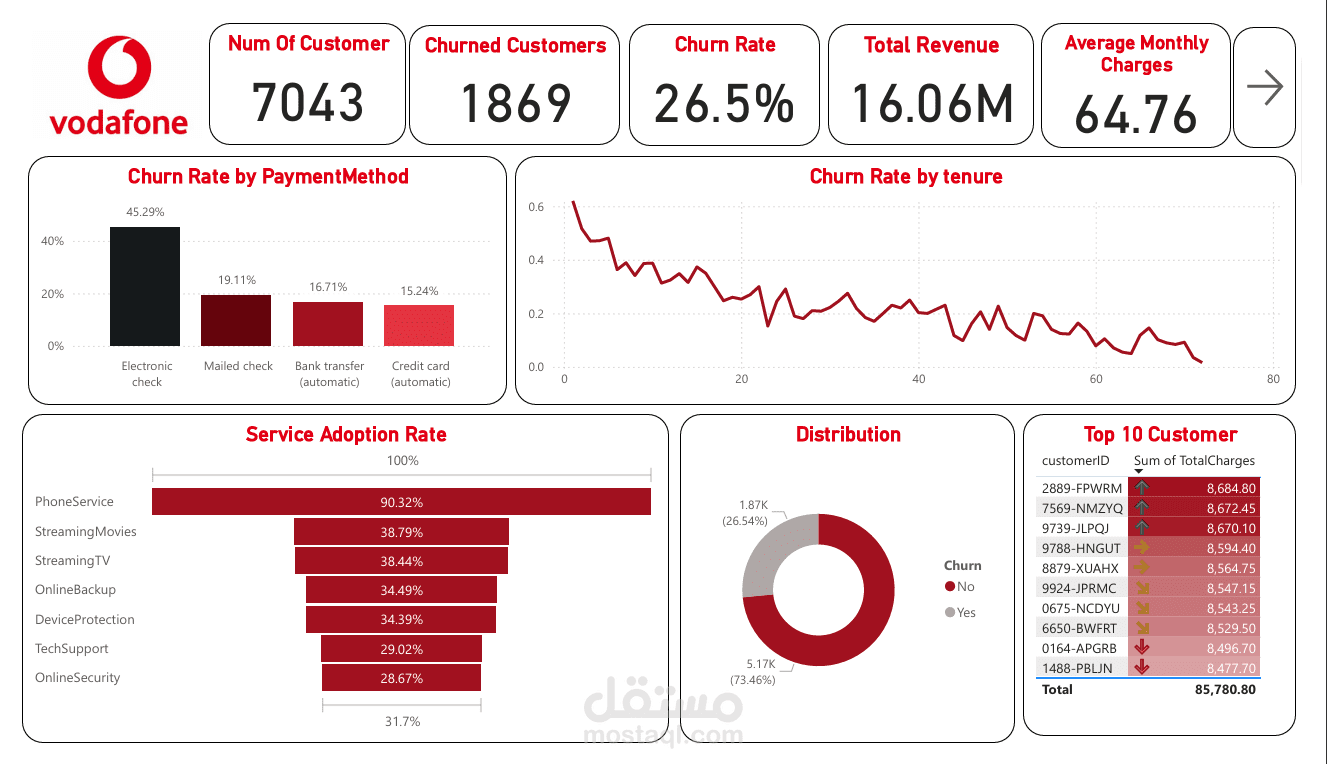
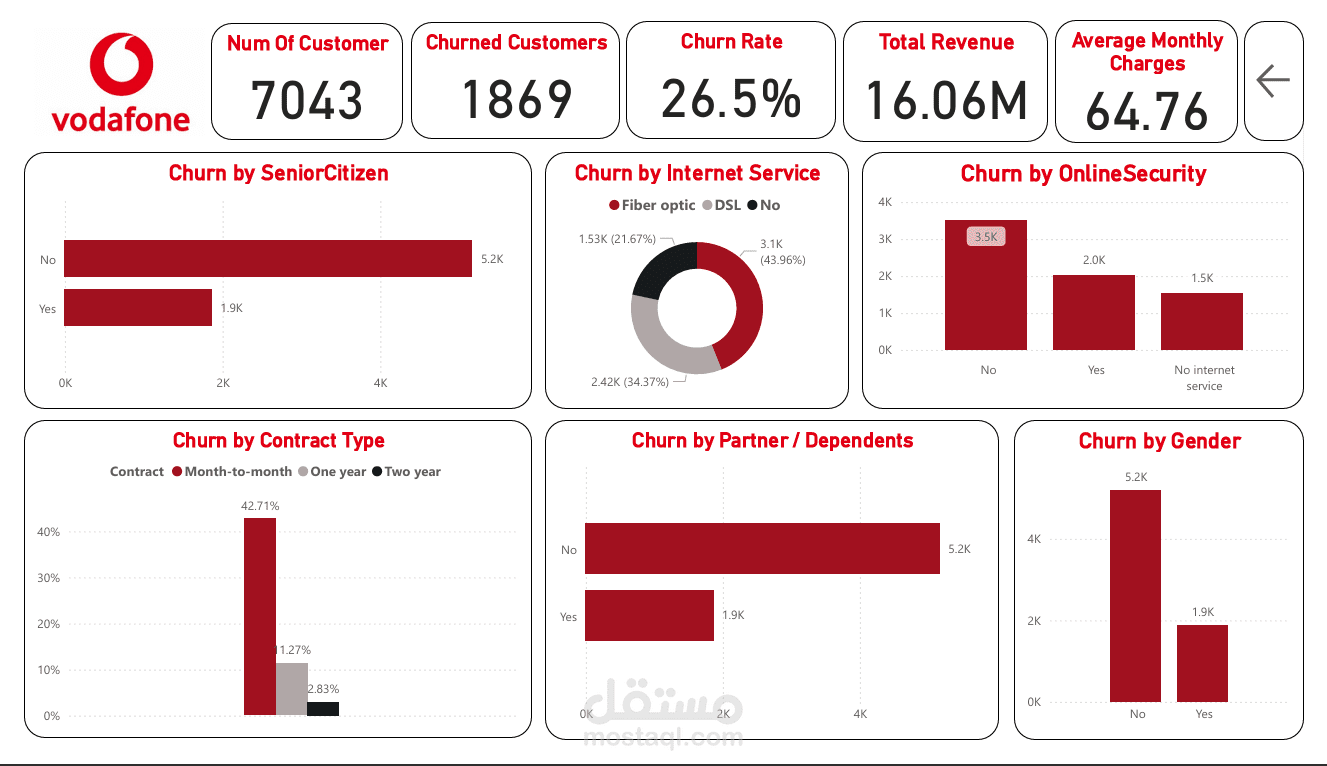
Customer Churn Dashboard (Vodafone-style design)
I created an analytical Customer Churn Dashboard using Power BI.
# Purpose of the analysis:
- Identify the main drivers of customer churn.
- Highlight the impact of service adoption on customer retention.
# Key Insights:
- Overall Churn Rate reached 26.5% of total customers.
- Customers on Month-to-Month contracts are the most likely to churn.
- Adoption of Online Security & Tech Support services is relatively low, which is strongly linked to higher churn.