Blink-it Grocery Data Analysis
تفاصيل العمل
The key problems Blinkit faces include:
1-Lack of Comprehensive Data Visibility
2-Limited Customer Analytics
3-Inventory Management not clear
Steps followed
Step 1 : requirement gathering(business requirement)
Step 2 : Data workthrough
Step 3 : Data connection
Step 4 : Data cleaning / quality check
Step 5 : Data modeling
Step 6 : data processing
Step 7 : DAX calculation
Step 8 : dashboard lay outing
Step 9 : charts development and formatting
Step 10 : dashboard/report development
Step 11 : insight generation
business requirement
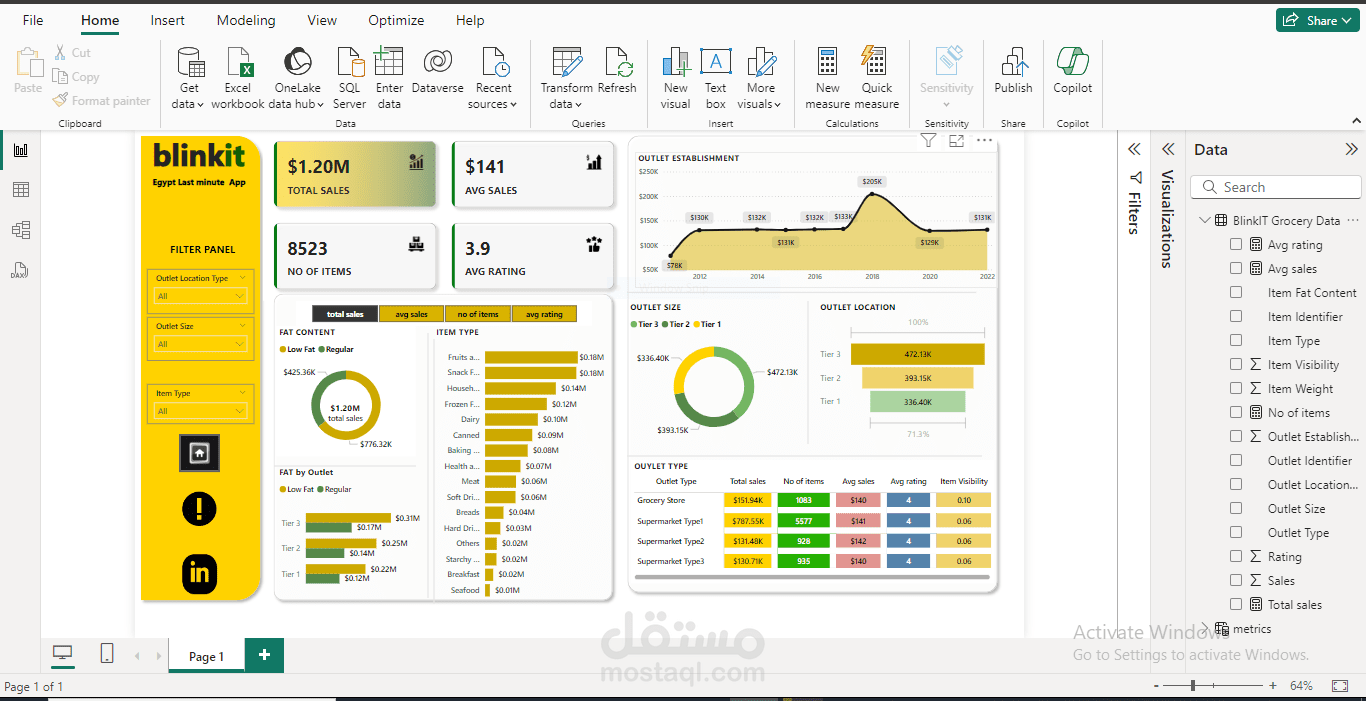
to condact acomprehnsive analysis of blinkit's sales performance customer sutisfaction and Inventory distribution to identify key insights and opportuinties for optimization using various KPIs and visulization in power BI
KPIs requirements
1- total sales: the overall generated from items sold.
2- average sales: average revinue per sale
3- number of items: the total count of different items sold 4- average rating: the average customer rating for item business
Chart's Requirements
Total Sales by Fat Content: Objective: Analyze the impact of fat content on total sales. Additional KPI Metrics: Assess how other KPIs (Average Sales, Number of Items, Average Rating) vary with fat content. Chart Type: Donut Chart.
Total Sales by Item Type: Objective: Identify the performance of different item types in terms of total sales.
Additional KPI Metrics: Assess how other KPIs (Average Sales, Number of Items, Average Rating) vary with fat content.
Chart Type: Bar Chart.
Fat Content by Outlet for Total Sales:
Objective: Compare total sales across different outlets segmented by fat content.
Additional KPI Metrics: Assess how other KPIs (Average Sales, Number of Items, Average Rating) vary with fat content.
Chart Type: Stacked Column Chart.
Total Sales by Outlet Establishment: Objective: Evaluate how the age or type of outlet establishment influences total sales. Chart Type: Line Chart.
Sales by Outlet Size: Objective: Analyze the correlation between outlet size and total sales.
Chart Type: Donut/ Pie Chart.
Sales by Outlet Location: Objective: Assess the geographic distribution of sales across different locations.
Chart Type: Funnel Map.
All Metrics by Outlet Type: Objective: Provide a comprehensive view of all key metrics (Total Sales, Average Sales, Number of Items, Average Rating) broken down by different outlet types.
Chart Type: Matrix Card.