Bike Most Sales
تفاصيل العمل
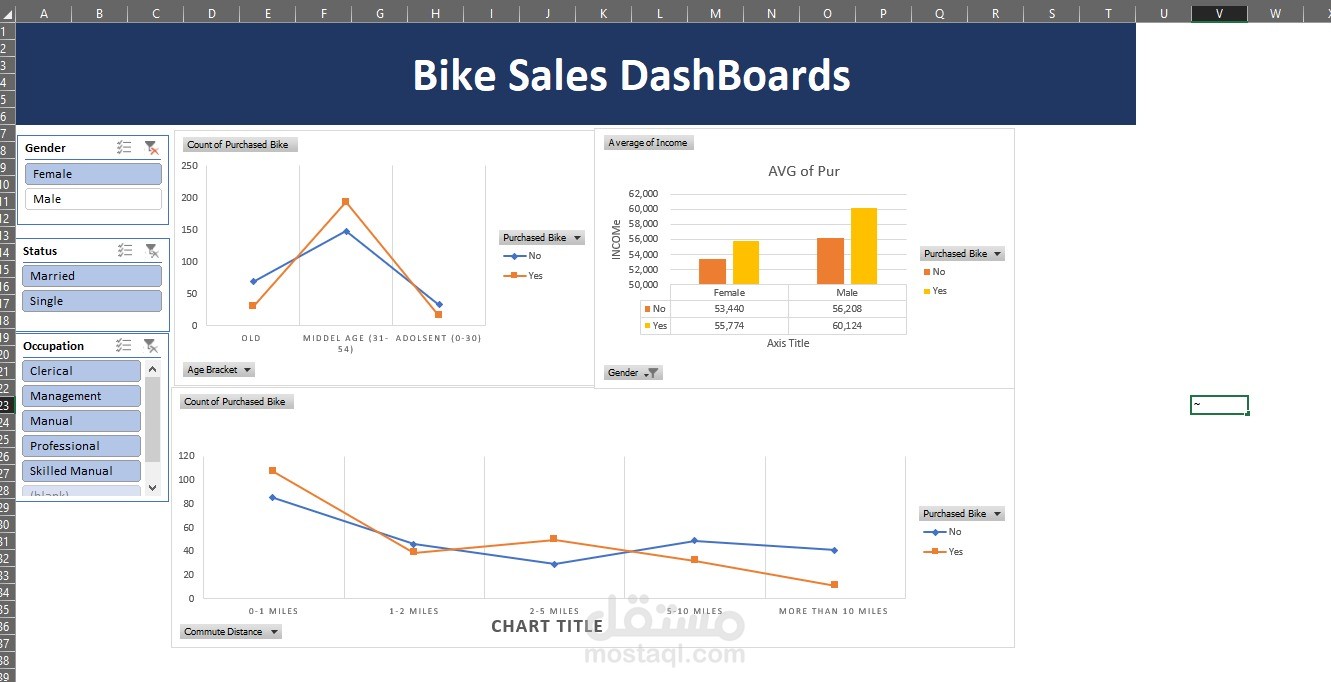
تعرض هذه لوحة مبيعات الدراجات التفاعلية تحليلًا سهلًا لفهم خصائص العملاء وسلوكهم في الشراء. تحتوي اللوحة على فلاتر مثل الجنس والحالة الاجتماعية والمهنة ومسافة التنقل لمعرفة تأثير كل عامل على قرار شراء الدراجة.
تشمل اللوحة رسومًا توضيحية مهمة، مثل:
المبيعات حسب العمر: خط بياني يوضح أي الفئات العمرية تشتري الدراجات أكثر.
الدخل والشراء: رسم يوضح الفرق في متوسط الدخل بين من اشتروا دراجة ومن لم يشتروا.
تأثير مسافة التنقل: رسم يوضح العلاقة بين مسافة سفر العميل من منزله إلى عمله وقراره بشراء الدراجة.
تساعد هذه اللوحة الشركات على فهم العملاء بشكل أفضل وتحليل اتجاهات المبيعات لاتخاذ قرارات مناسبة مبنية على البيانات