Bike Sales Dashboard – Data Analysis Using Excel
تفاصيل العمل

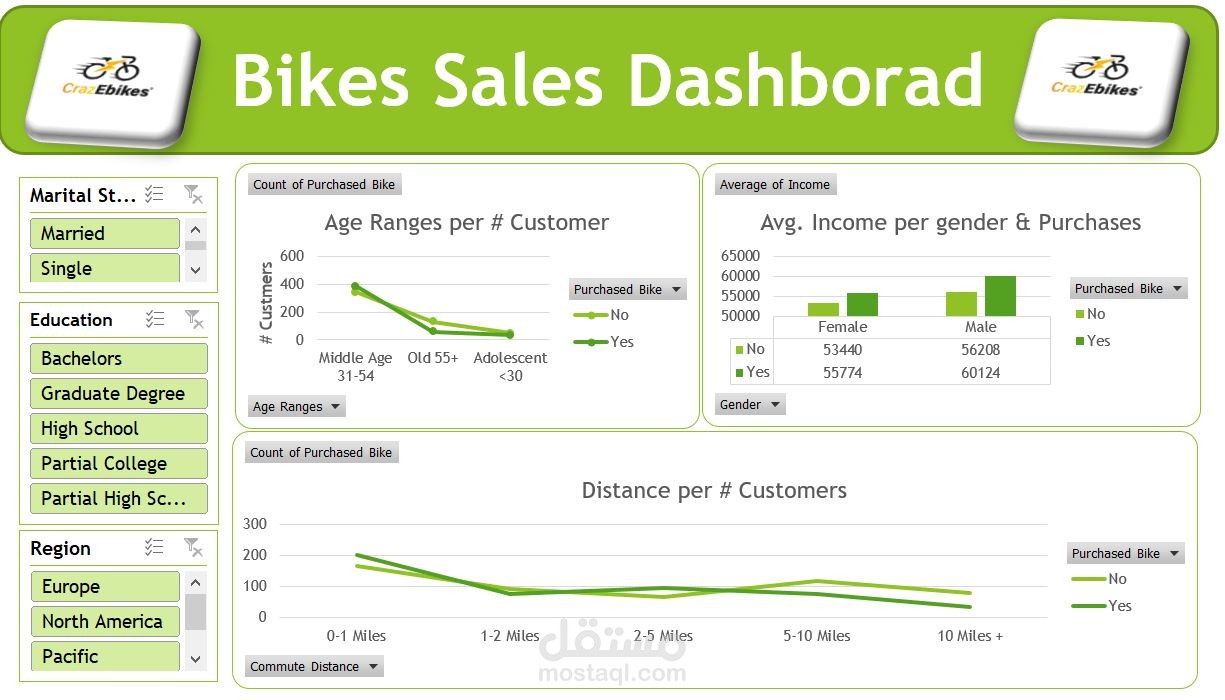
This project involved building a comprehensive and interactive Bike Sales Dashboard using Microsoft Excel to analyze sales data and extract actionable business insights. The goal was to help stakeholders monitor key performance indicators (KPIs), identify top-performing products and regions, and support data-driven decision-making.
The dataset included information such as customer demographics, product categories, order dates, sales amounts, and geographic locations.
Key Features & Achievements:
:Data Cleaning & Preparation
Cleaned and structured raw sales data using Power Query
Removed duplicates, handled missing values, and standardized date and text formats
:Sales Analysis
Calculated Total Sales, Average Order Value, and Total Units Sold
Analyzed sales by bike category (e.g., Road, Mountain, Electric)
Identified top-selling products and high-performing regions
:Customer Analysis
Segmented customers by age, gender, and region
Analyzed customer purchasing patterns and repeat orders
:Time-Based Trends
Created monthly and yearly sales trends
Used timelines and slicers for easy filtering by date range
:Interactive Dashboard
Designed a dynamic and user-friendly dashboard with:
PivotTables and PivotCharts
KPIs (Revenue, Orders, Avg. Sales)
Drop-downs and slicers for custom filtering
Bar, Line, and Pie charts for clear data visualization
:Insights & Recommendations
Highlighted the most profitable product segments
Identified underperforming regions for targeted improvements
Suggested strategies to optimize inventory and marketing