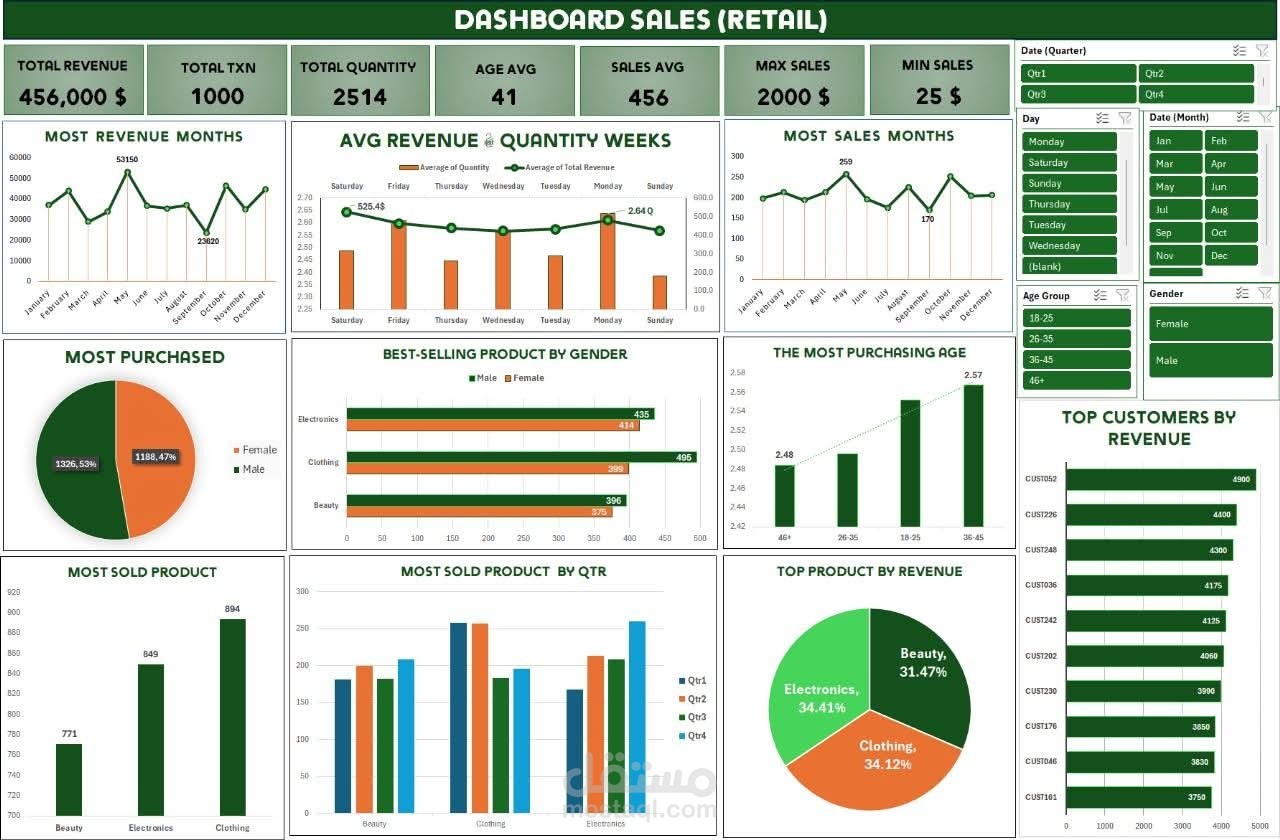
A car_sales dashboard
تفاصيل العمل
Car Sales Dashboard
Description:
Designed and developed an interactive dashboard to analyze car sales performance across regions, models, and time periods. The dashboard provides clear insights into sales trends, top-performing car categories, and revenue growth patterns.
Technical Steps:
Data Preparation: Collected and cleaned raw sales data from Excel/CSV sources.
Exploratory Analysis: Identified key metrics such as total sales, revenue per region, and most sold car models.
Dashboard Design: Built dynamic visualizations including bar charts, line graphs, and KPIs to track performance.
Interactivity: Implemented filters for region, time, and car category, enabling users to drill down into details.
Result: Delivered a decision-support tool for managers to monitor performance and identify sales opportunities.
Tools & Technologies: Power BI (or Tableau), Excel, SQL, Data Visualization
