Superstore Sales Analysis — From Raw Data to Business Decisions.
تفاصيل العمل
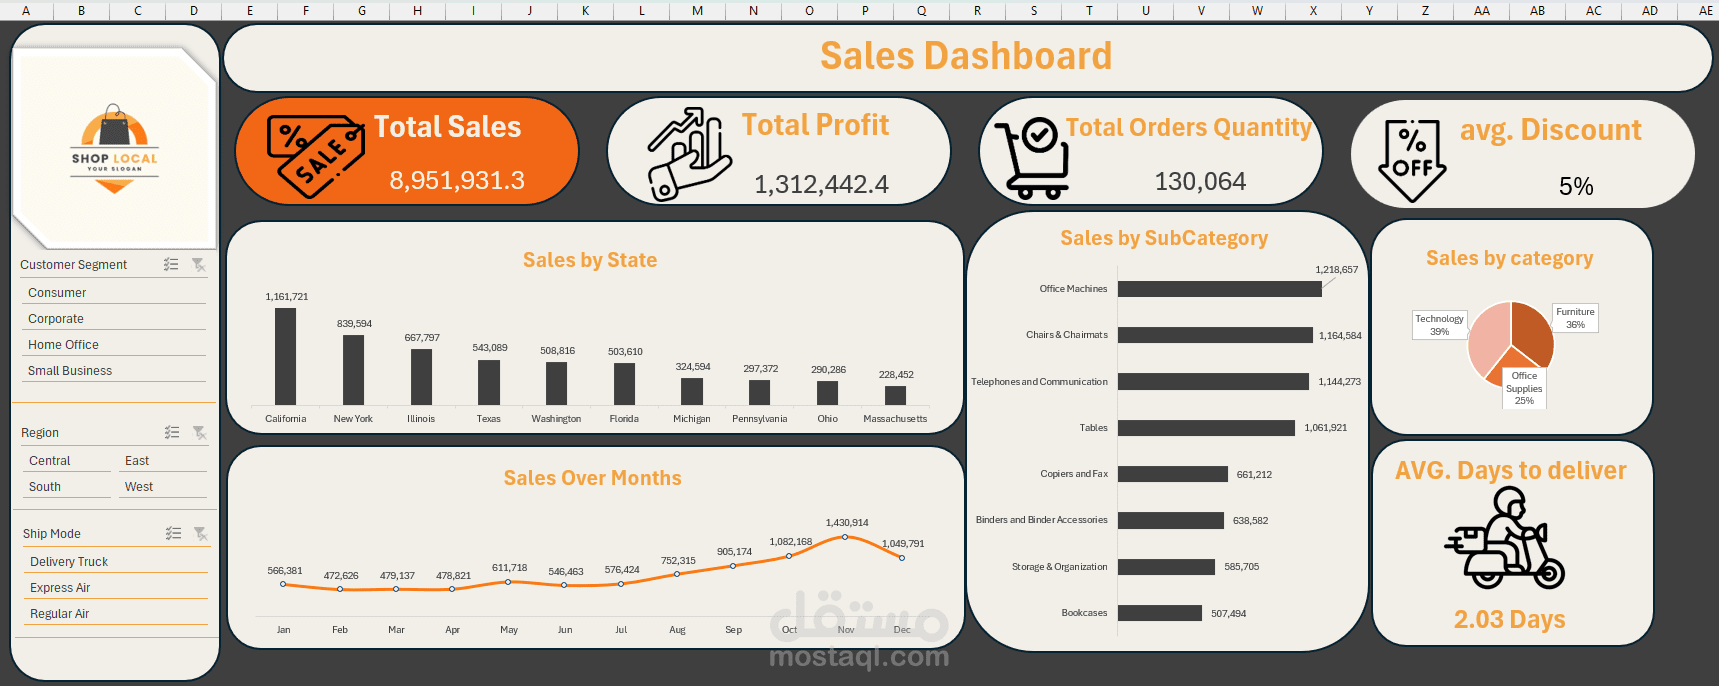
I developed an interactive Excel dashboard using the Superstore Sales dataset to analyze and visualize retail performance. The dashboard provides business insights into revenue, profit, and customer behavior with interactive filters and KPIs.
Key Insights & Features:
KPIs: Total Sales (8.9M), Total Profit (1.3M), Quantity Sold (130K).
Trend Analysis: Sales over time to identify seasonal patterns.
Category & Sub-Category breakdown for better product insights.
Ship Mode performance analysis.
Top 10 States by sales.
Tools & Skills: Excel, Power Query, Data Cleaning, Data, Data Visualization.
This project enhanced my skills in data storytelling, dashboard design, and translating raw data into actionable insights.