تفاصيل العمل

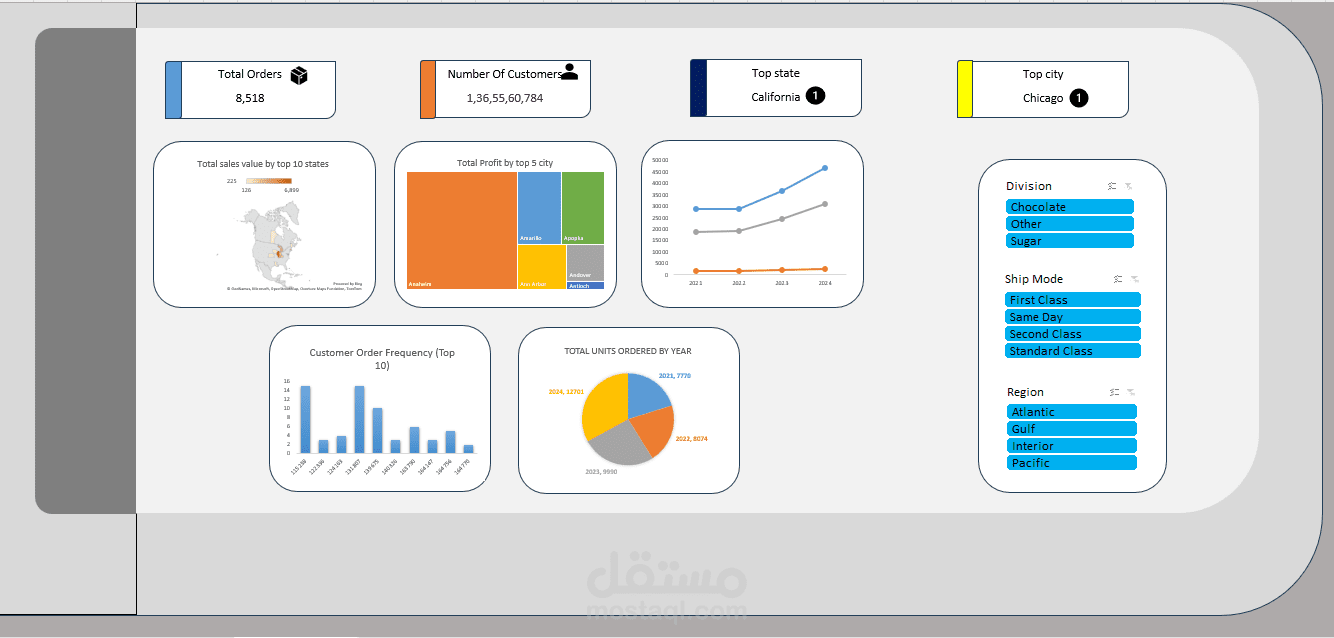
This dashboard provides a comprehensive and at-a-glance overview of key business performance metrics. At the top, it highlights critical summary statistics, including Total Orders (8,518), the impressive Number of Customers (1.36 billion), and the top-performing State (California) and City (Chicago). The central section uses a variety of charts to visualize data: a map showing total sales value by the top 10 states, a bar chart detailing total profit by the top 5 cities, and a line graph tracking sales trends over time. Additionally, a pie chart breaks down total units ordered by year, while a bar chart illustrates customer order frequency. The right-hand side features interactive filters for Division, Ship Mode, and Region, allowing users to drill down and segment the data for more granular analysis. Overall, this is a powerful and intuitive tool designed for quick insights and data-driven decision-making.

بطاقة العمل

اسم المستقل
عدد الإعجابات
0
عدد المشاهدات
1
تاريخ الإضافة
تاريخ الإنجاز
المهارات