Airports Performance analysis
تفاصيل العمل
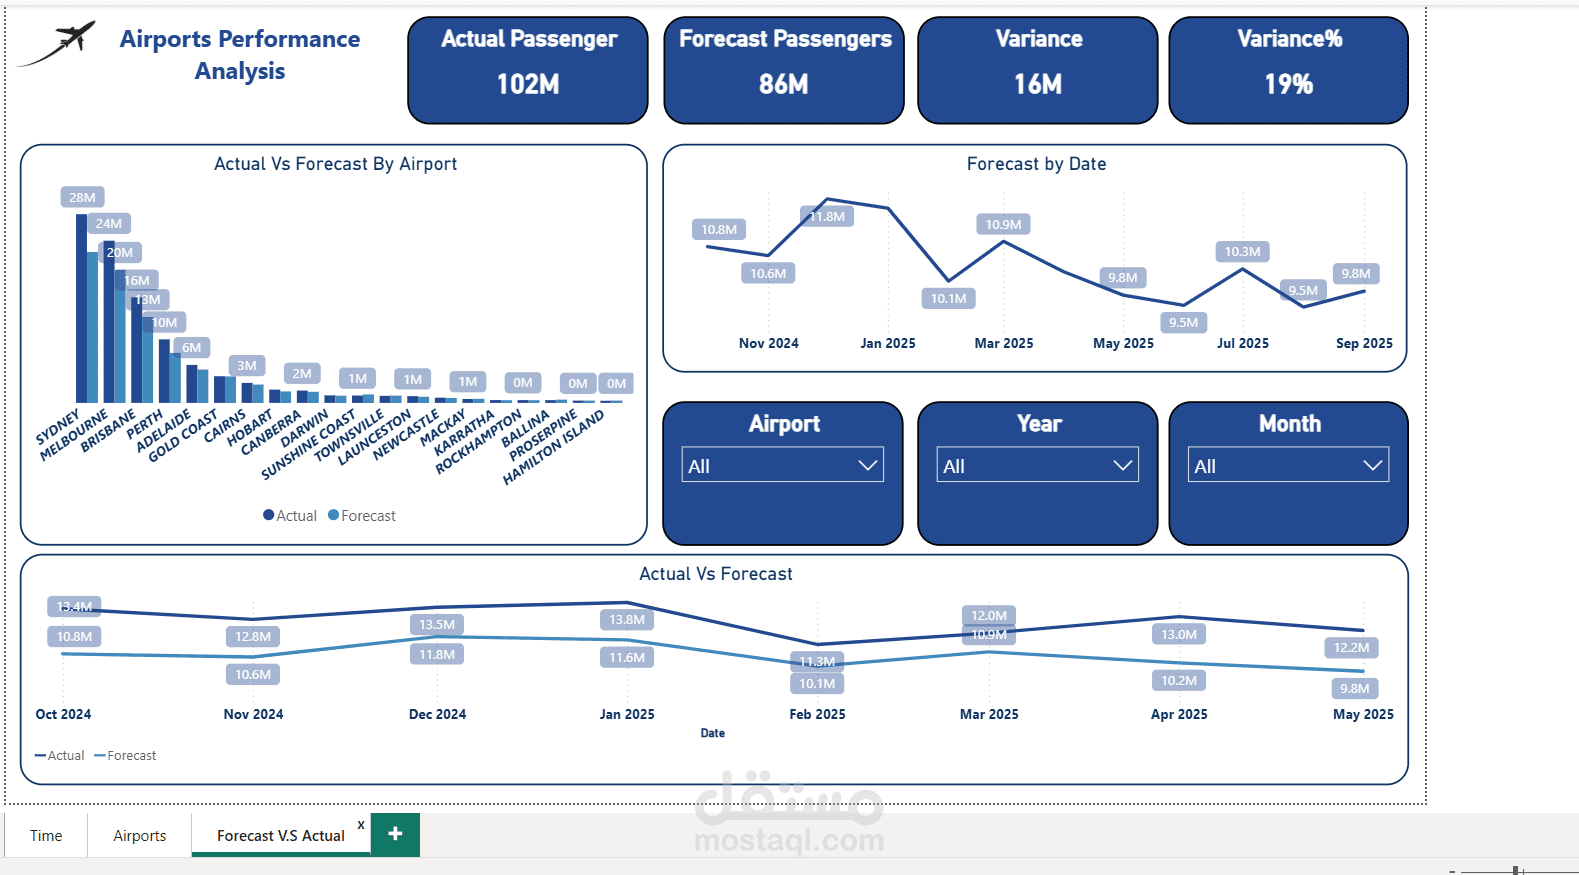
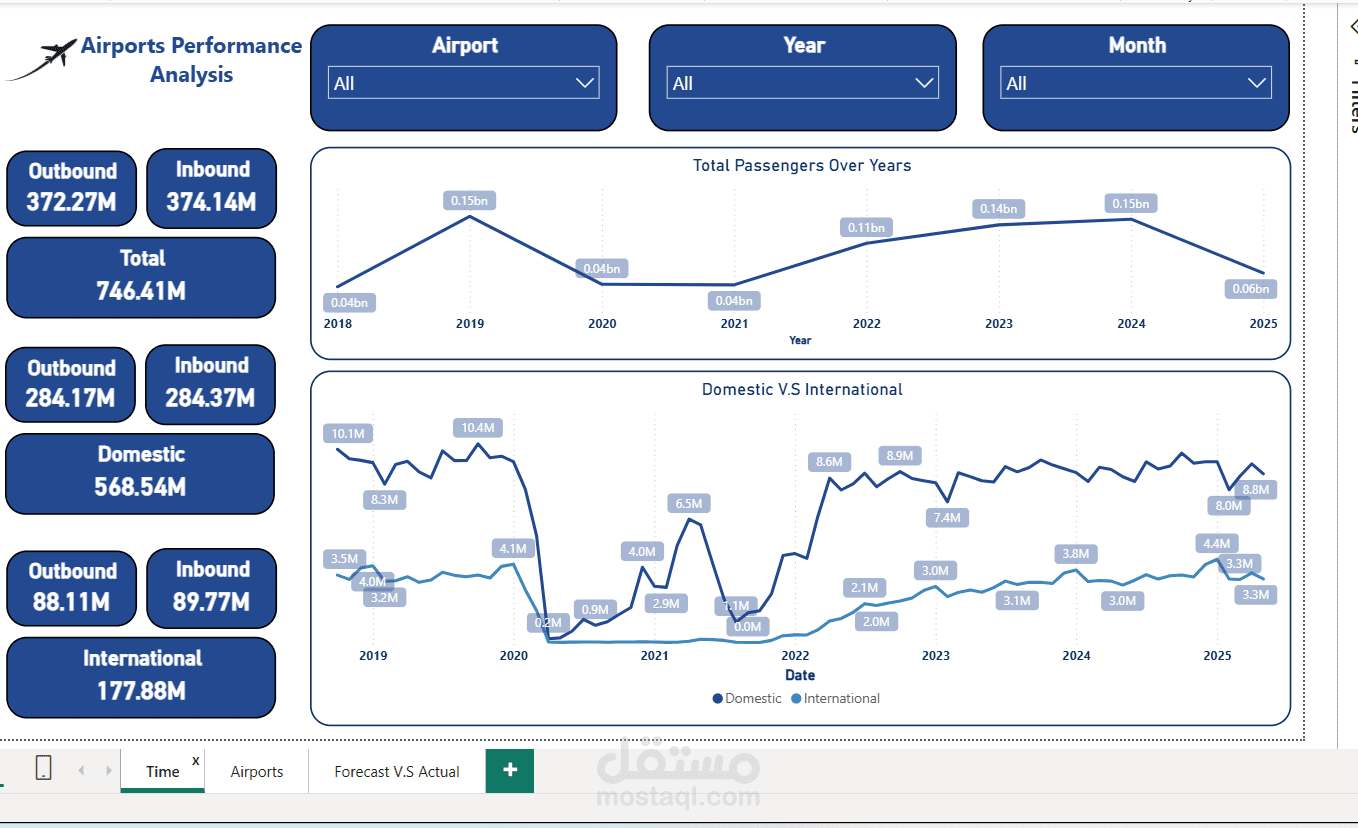
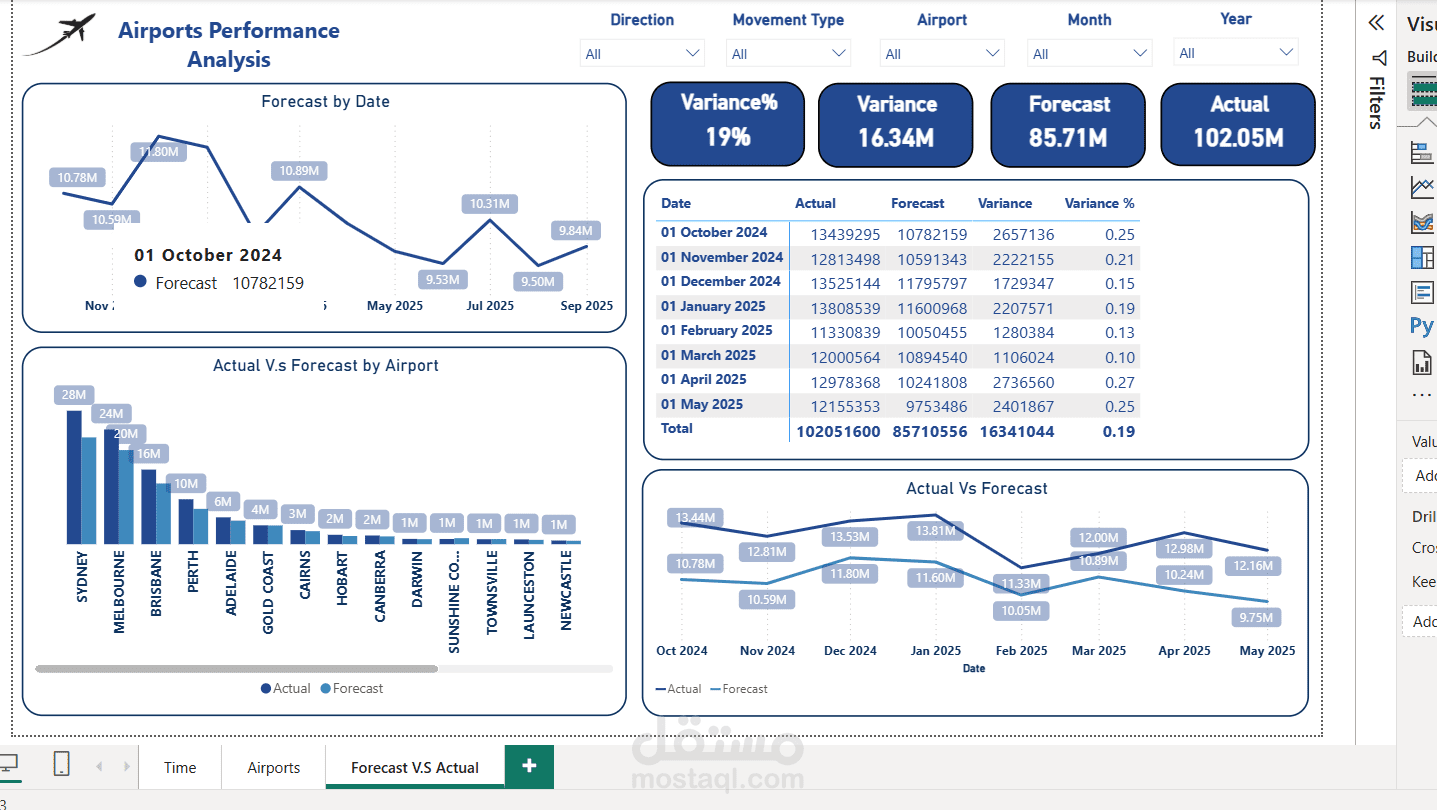
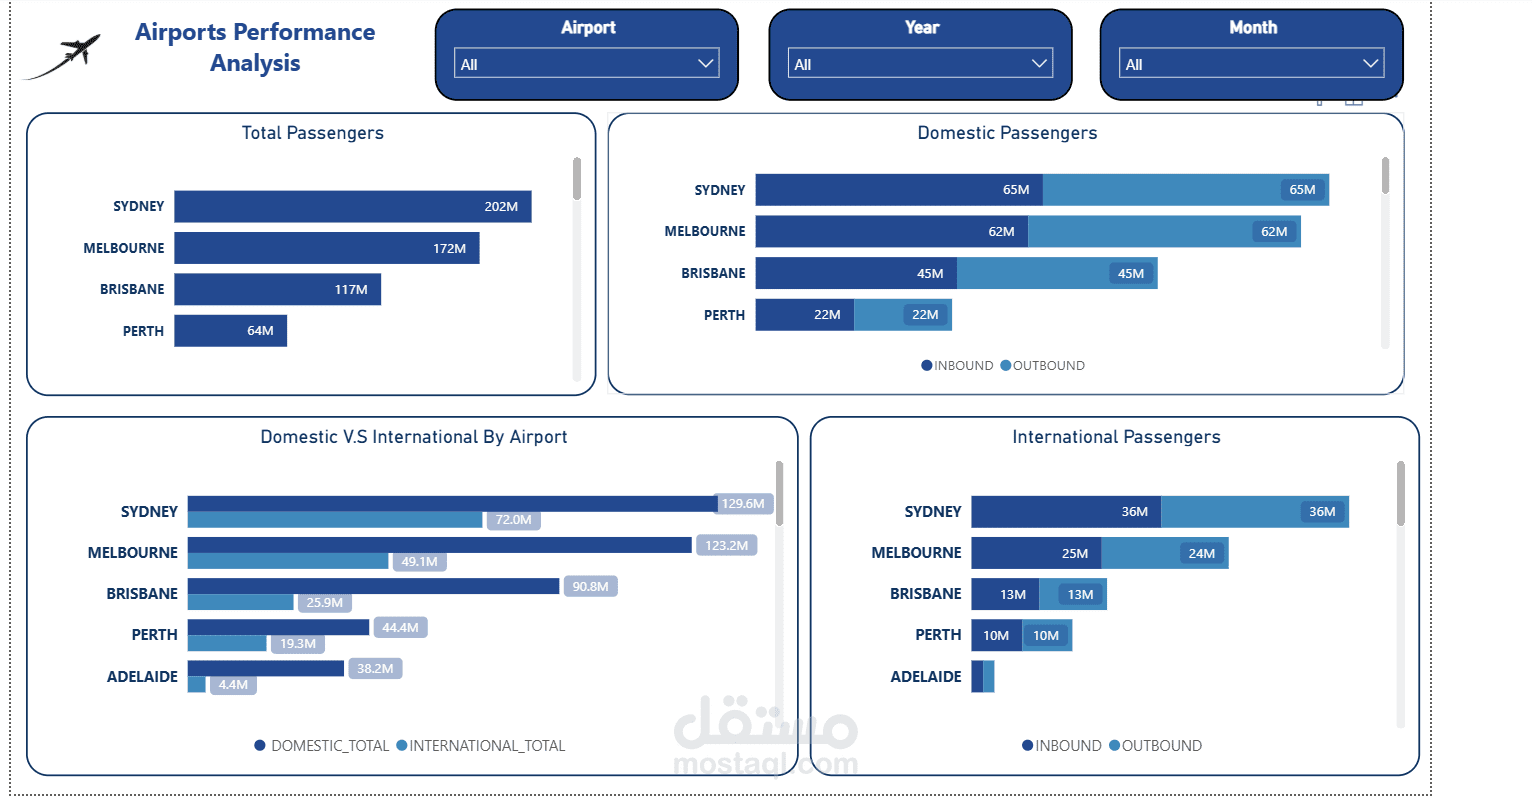
I designed and built an interactive Power BI dashboard to track passenger volumes across major Australian airports, with a sharp focus on Forecast vs Actual performance. The model trains on multi-year history (Oct 2018–Sep 2024) and projects Oct 2024–Sep 2025; it then compares Actuals vs Forecasts for the months available (Oct 2024–May 2025), surfacing monthly variance and variance% in an easy, audit-friendly table plus a year-to-date roll-up.