Excel Pivot Table Dashboard
تفاصيل العمل
Description
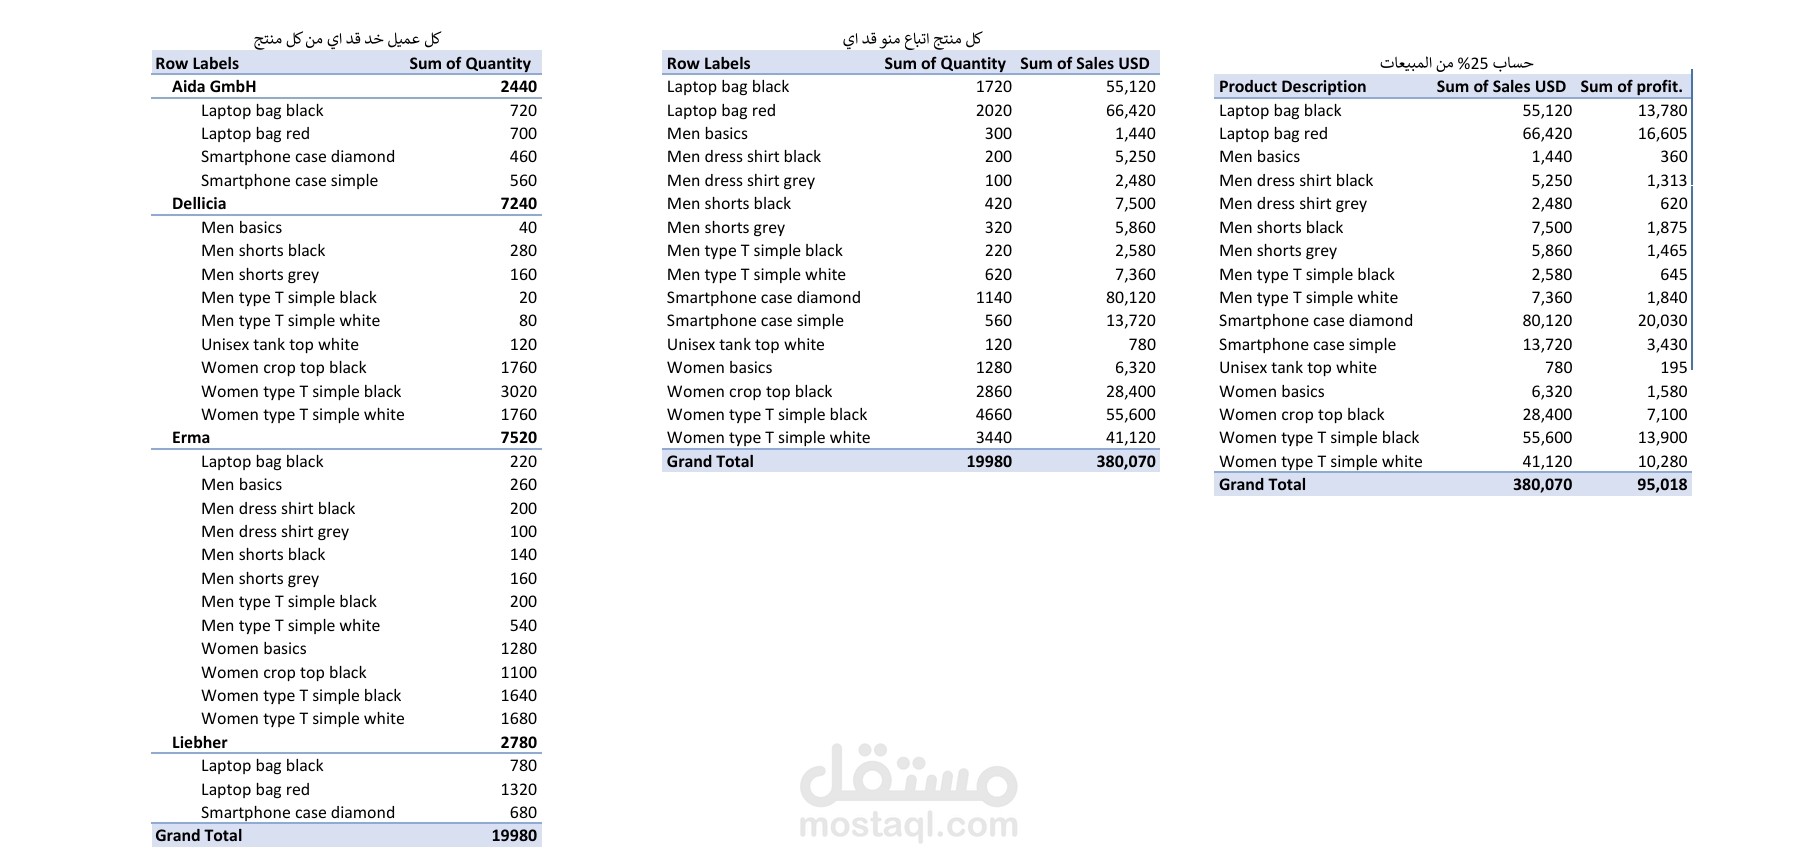
Developed an interactive Excel dashboard using Pivot Tables and Pivot Charts to visualize sales, costs, and inventory movement. The dashboard enabled management to track performance KPIs in real-time and make data-driven decisions.
Outcomes:
Reduced reporting time by 50% through automation.
Improved decision-making speed for management by visualizing key insights in a single dashboard