Sales Dashboard - Excel
تفاصيل العمل
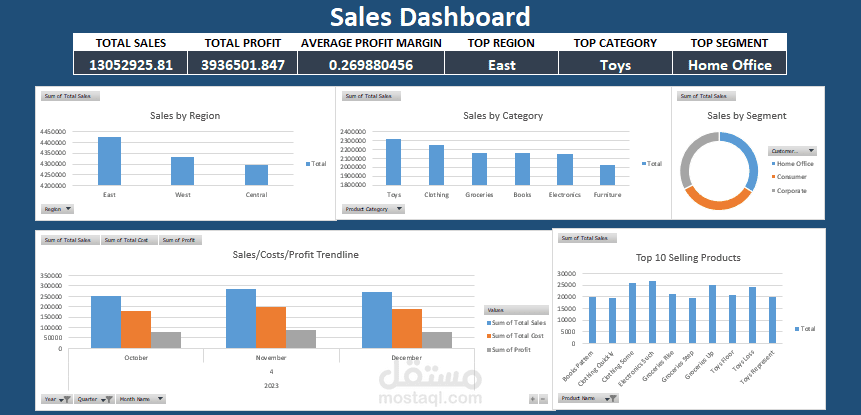
This project involved designing and developing a dynamic Excel sales dashboard to replace static and manual reports. The goal was to automate data analysis and provide managers with real-time insights into regional and product performance.
Implementation Details:
Cleaned and structured raw sales data using Excel Tables and Power Query to ensure consistency and automation.
Created Pivot Tables and Pivot Charts to analyze sales by region, category, and time period.
Designed summary KPIs to display total revenue, growth percentage, and top-performing regions.
Built formulas using IF, INDEX-MATCH, SUMIFS, and conditional formatting to highlight trends and anomalies.
Outcome:
The dashboard reduced manual report creation time by over 70% and gave stakeholders a clear, automated view of performance trends.
Tools Used:
Microsoft Excel, Power Query, Pivot Tables, Data Visualization, Dashboard Design