Retail Business and Operational Performance Dashboard
تفاصيل العمل
Smart decisions start with smart data insights
In today’s fast-paced business world, intuition alone is not enough — data has become the true compass that provides organizations with a sustainable competitive advantage.
I’m excited to share a glimpse of the latest performance dashboard I’ve developed, designed to transform raw numbers into actionable insights and strategic clarity that empower decision-makers.
The project includes five interactive dashboards built using Microsoft Excel tools:
Power Query
Power Pivot
Pivot Table
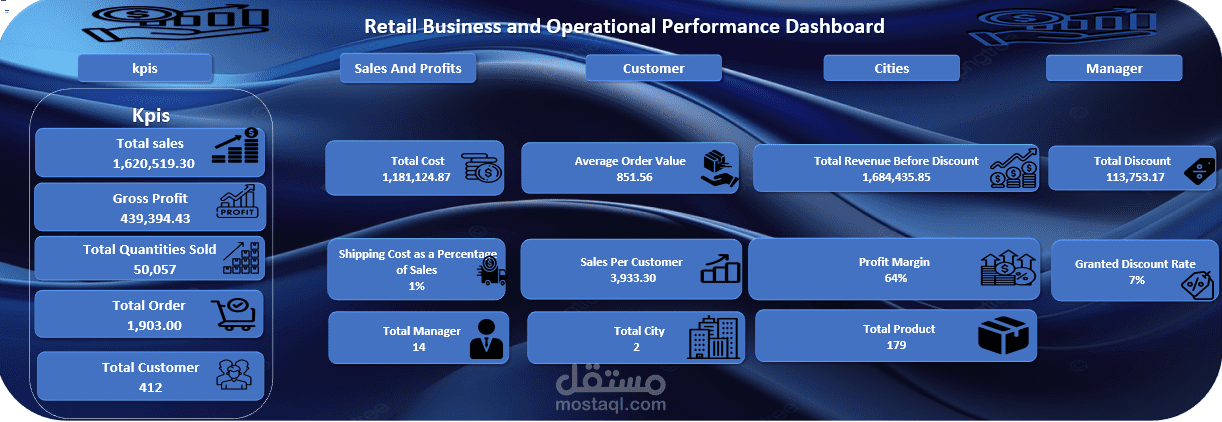
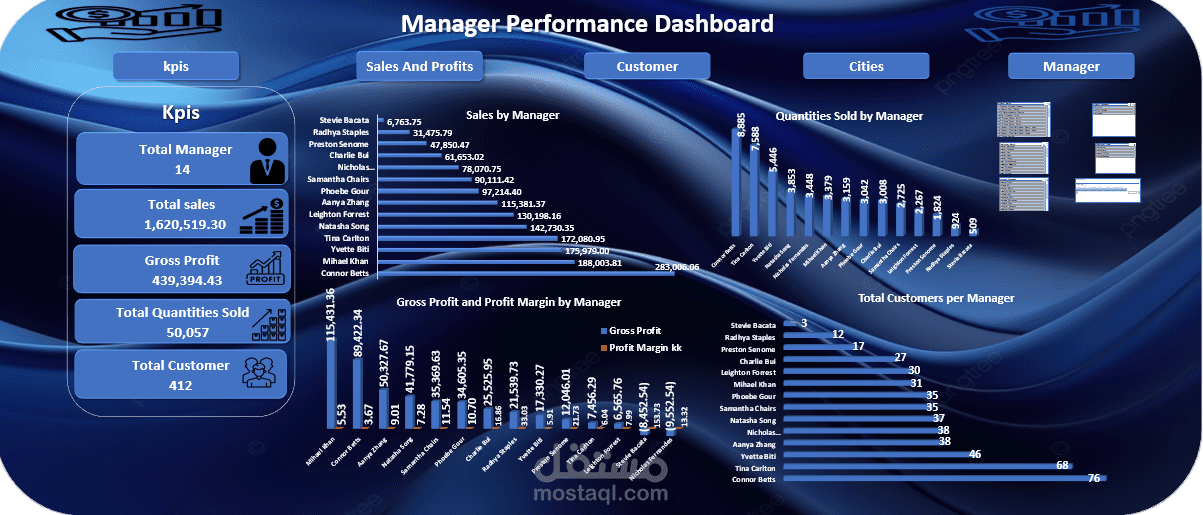
These dashboards highlight the most important Key Performance Indicators (KPIs), including:
Total Sales: 1,620,519.30
Total Profits: 439,394.43
Total Quantity Sold: 50,057
In addition, other dashboards provide deeper insights such as:
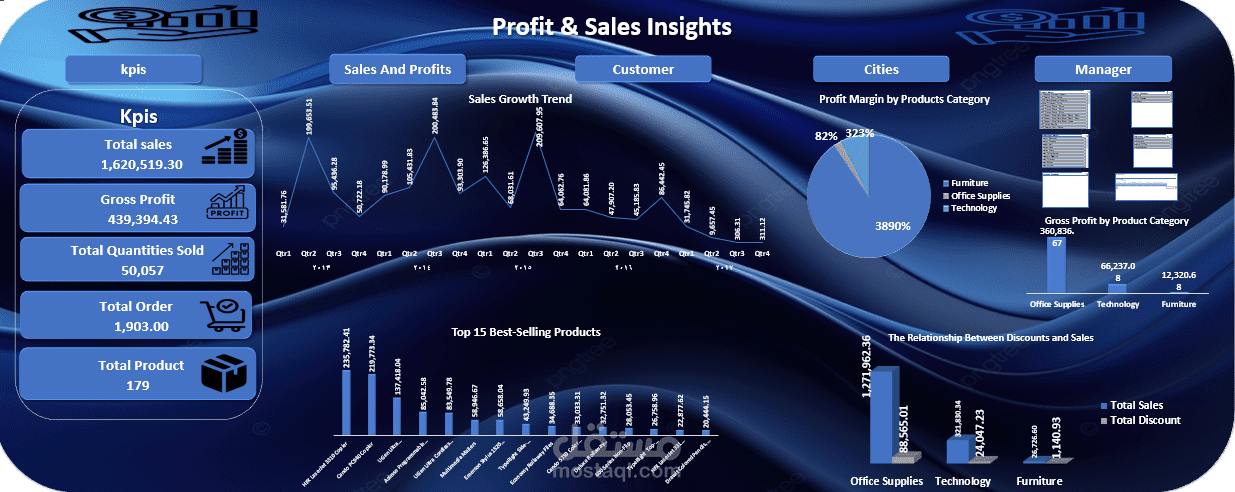
Sales Growth Rate
Top-Selling Products
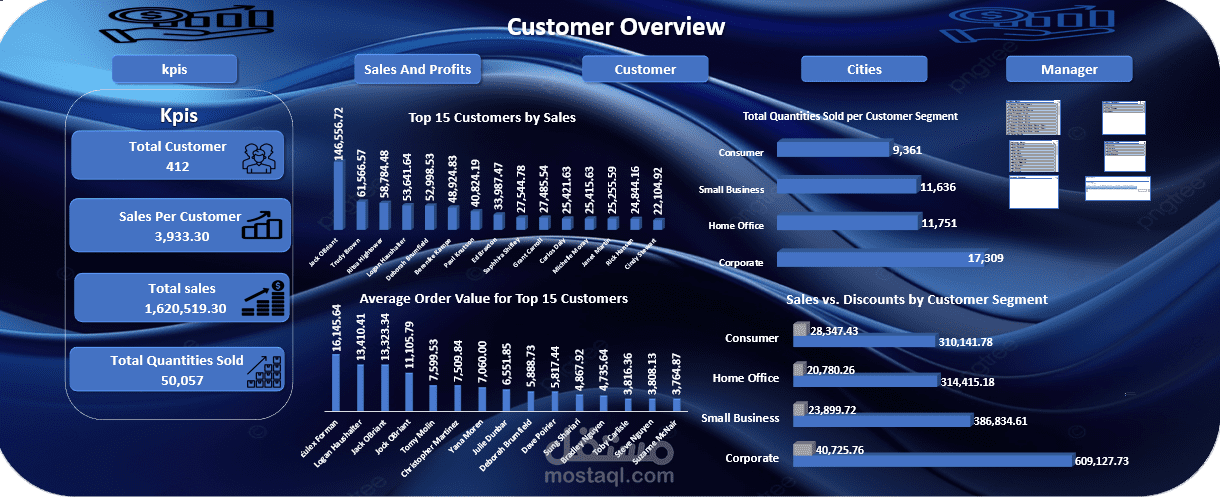
Key Customers by Purchase Volume
Managerial Performance, including identifying top-performing managers and tracking the profits each manager contributes to the company.
In short: Every number tells a story, and every dashboard provides a wider vision