Sales Performance Dashboard
تفاصيل العمل
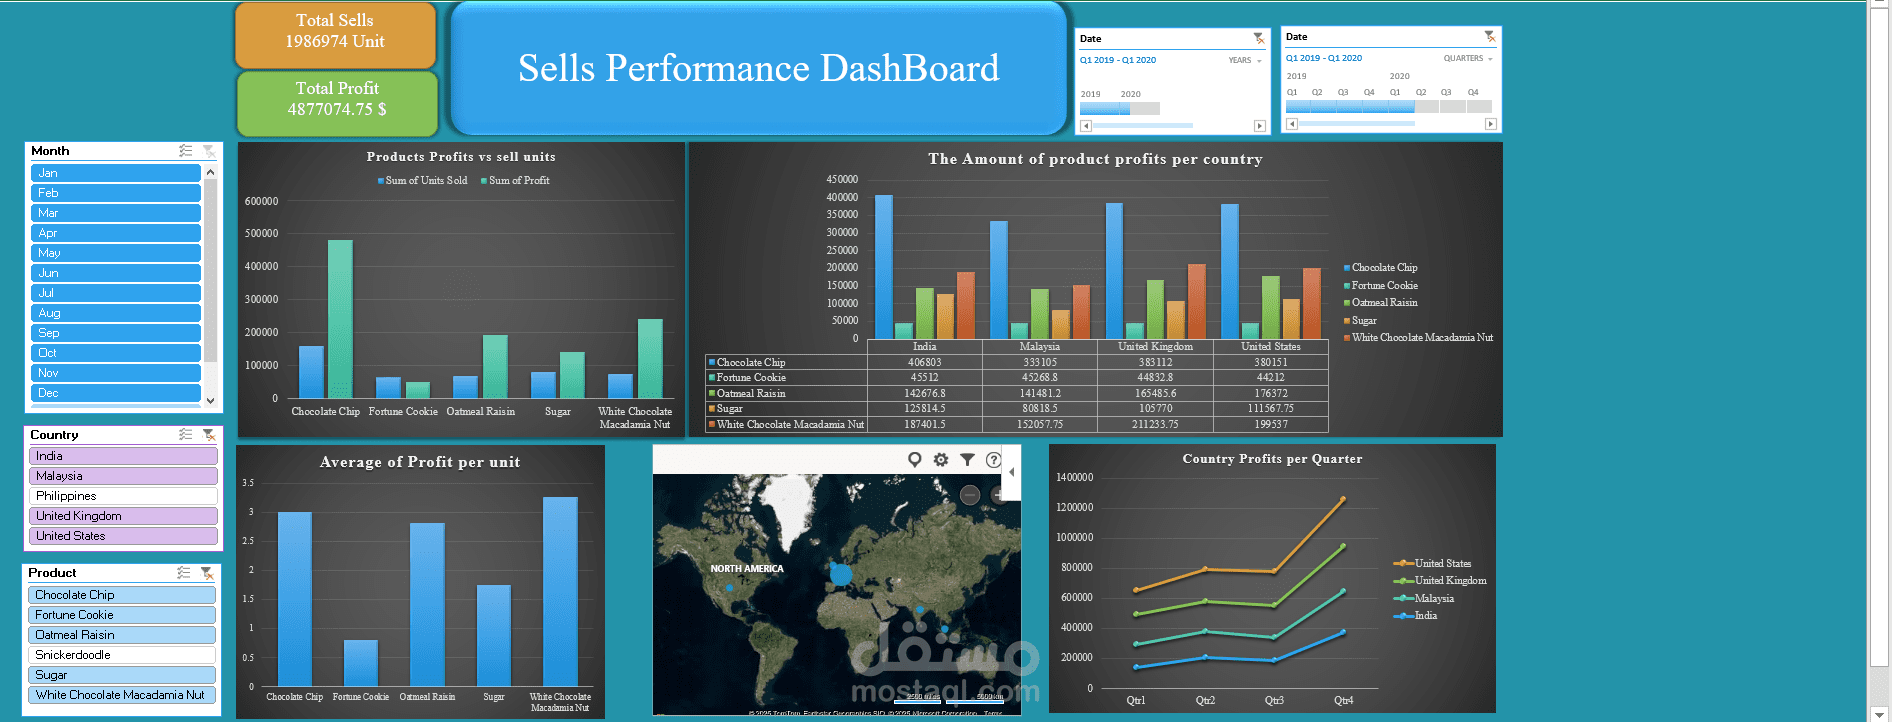
I designed and built this interactive dashboard to analyze sales performance across multiple dimensions, providing both high-level KPIs and detailed insights.
Key Features:
Dynamic KPIs – Track total sales units & profit in real time
Product Performance Analysis – Compare sales & profitability across product categories
Regional Insights – Breakdown of sales and profits by country with interactive maps
Trend Analysis – Visualize performance over time with quarter-by-quarter comparisons
Interactive Slicers & Filters – Slice data by month, country, or product to uncover insights
Conditional Formatting – Highlight top/bottom performers for quick decision-making
This project helped me strengthen my skills in:
Data visualization & storytelling
KPI design & performance monitoring
Building interactive dashboards for business decision-making
Here’s Project Link : https://lnkd.in/dqAZXSeJ
Here's Project data link : https://lnkd.in/ddPJc6C2