Analyzing Customer Trends Over Time
تفاصيل العمل
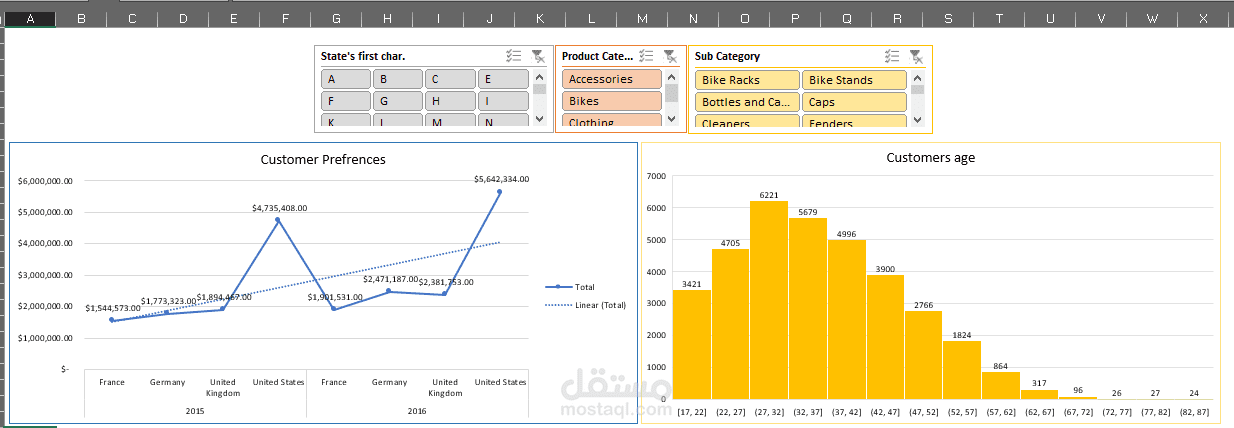
In this project, I organized and formatted the dataset to prepare it for analysis. I extracted customer ages and grouped them into ranges to build a histogram that visualized age distribution. Using Pivot table, I created a line chart summarizing the total revenue across France, Germany, the United Kingdom, and the United States for the years 2015 and 2016. To enhance interactivity, I added slicers for product categories, subcategories, and the first character of states, and managed their connects to apply to both charts enabling users to filter total revenue dynamically based on their needs.
في هذا المشروع قمت بتنظيم وتنسيق البيانات لتجهيزها للتحليل. استخرجت أعمار العملاء وقمت بتجميعها في نطاقات لإنشاء مخطط هيستوجرام يوضح توزيع الأعمار. باستخدام Pivot Table أنشأت مخطط خطي يلخص إجمالي الإيرادات في فرنسا وألمانيا والمملكة المتحدة والولايات المتحدة خلال عامي 2015 و2016. ولتعزيز التفاعل، أضفت Slicers تحتوي على فئات المنتجات، الفئات الفرعية، وأول حرف من أسماء الولايات، وقمت بإدارة الروابط الخاصة بها لتُطبق على كلا المخططين مما أتاح للمستخدمين تصفية الإيرادات الإجمالية بشكل مخصص وسهل.