Comparing Sales Data Across Multiple Regions
تفاصيل العمل
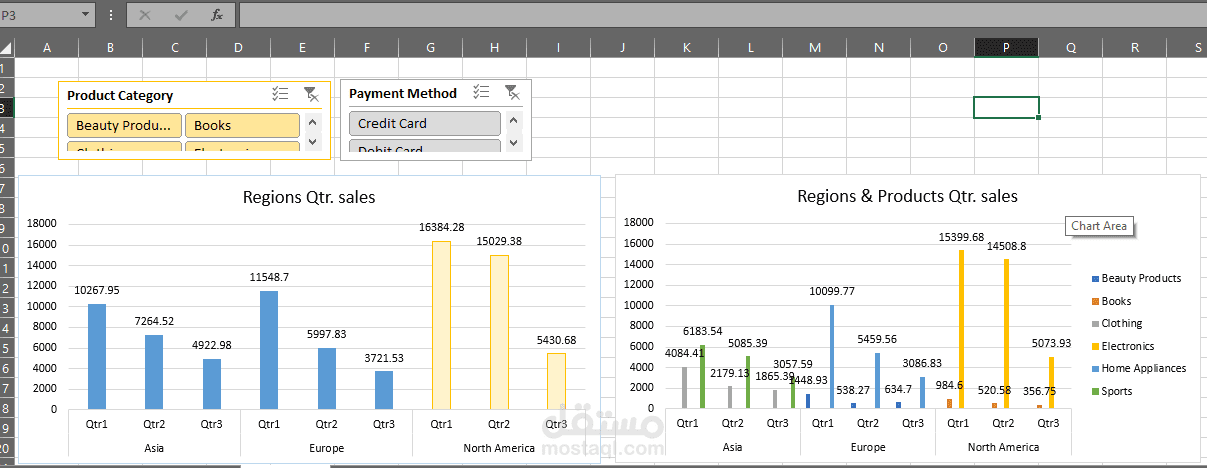
In this project, I cleaned and prepared raw data to ensure accuracy and readiness for analysis. Using Pivot table, I created the first chart showing quarterly sales across Asia, North America, and Europe.
I then applied Pivot table again to build a second chart that displayed quarterly product sales across the same three regions. To enhance interactivity, I added slicers and configured their connections so that all charts responded dynamically