Sales Dashboard
تفاصيل العمل
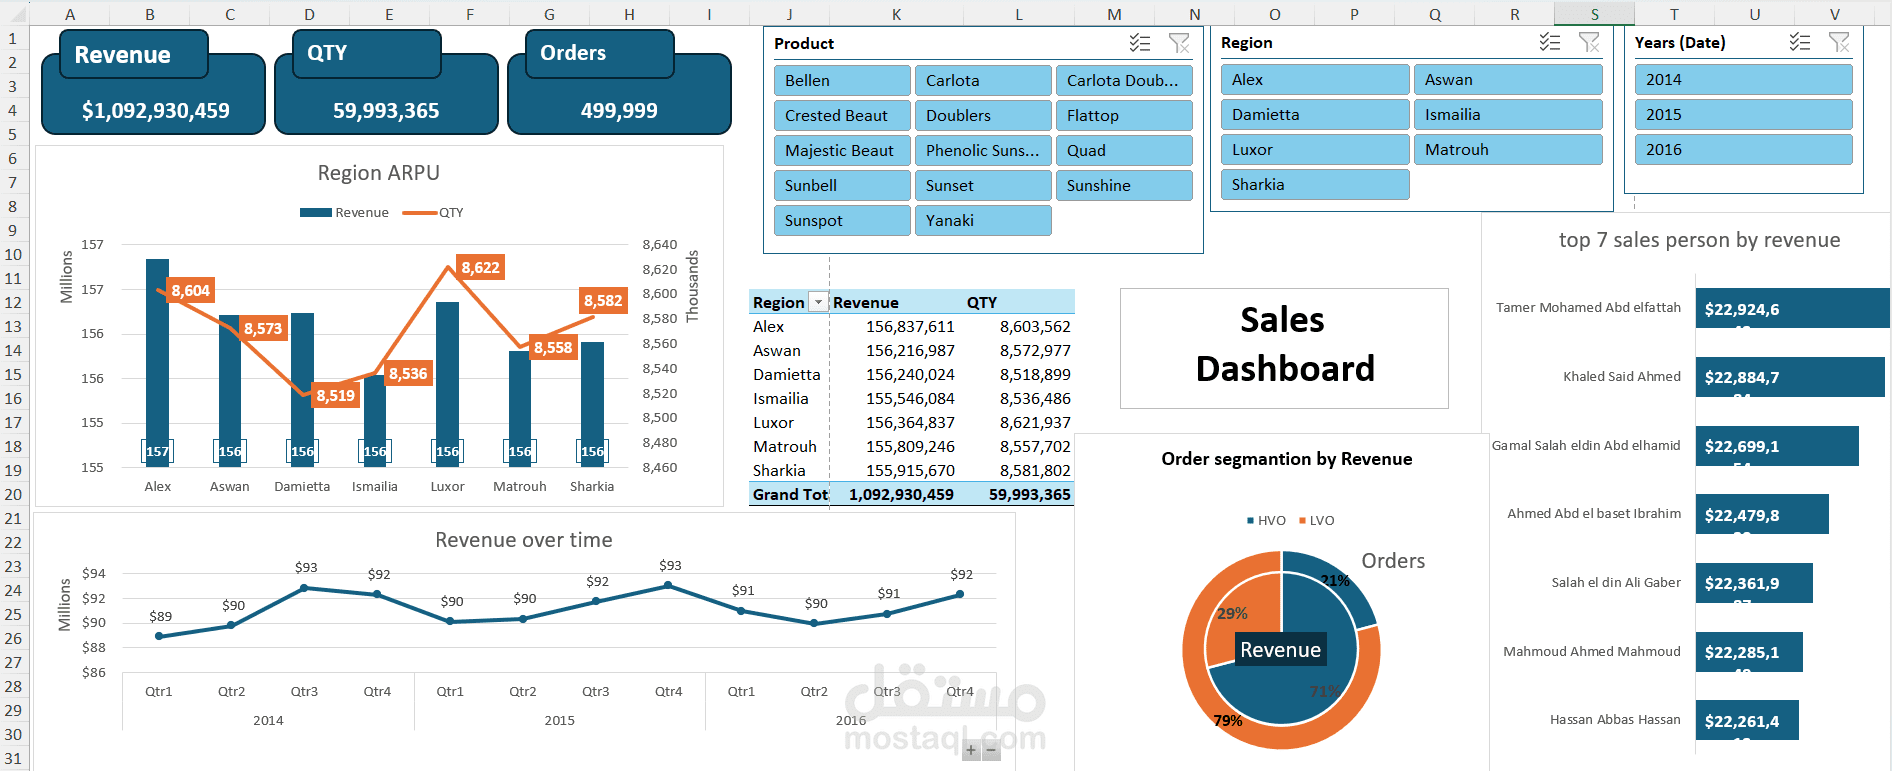
The challenge was to analyze over 500,000 rows of data using Excel, and extract meaningful insights that could support decision-making.
I worked with:
️ Pivot Tables
️ Dashboards
️ Charts & Visualizations
️ Sales performance by region and sales reps
The result?
I was able to transform raw data into clear, actionable insights that actually make a difference