HR Dashboard
تفاصيل العمل
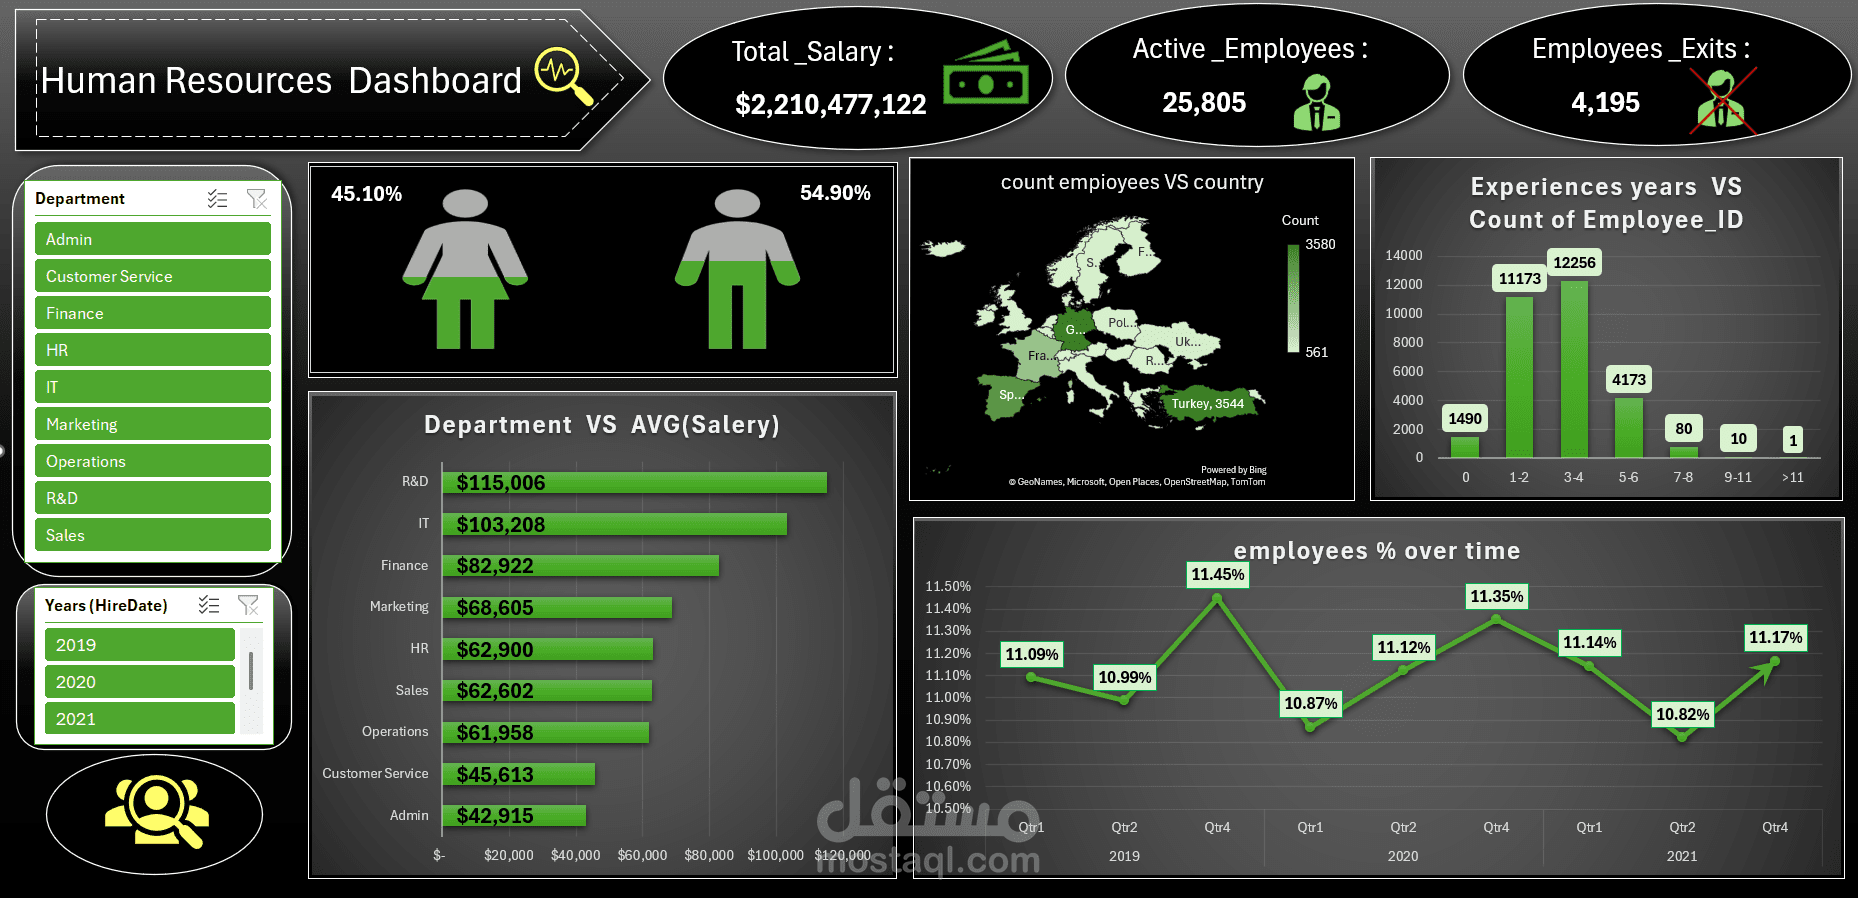
Interactive Employee Dashboard in excel
Worked on analyzing over 30,000 rows of employee data to support HR decision-making and workforce planning.
Key Insights:
Highest employee concentration in Germany , followed by France and Italy.
Most common experience level: 3–4 years.
Noticeable differences across departments, highlighting opportunities to better balance resources.
Value Added:
Data cleaning and preparation using Power Query
PivotTables and interactive maps to turn numbers into actionable insights