Building a dashboard
تفاصيل العمل
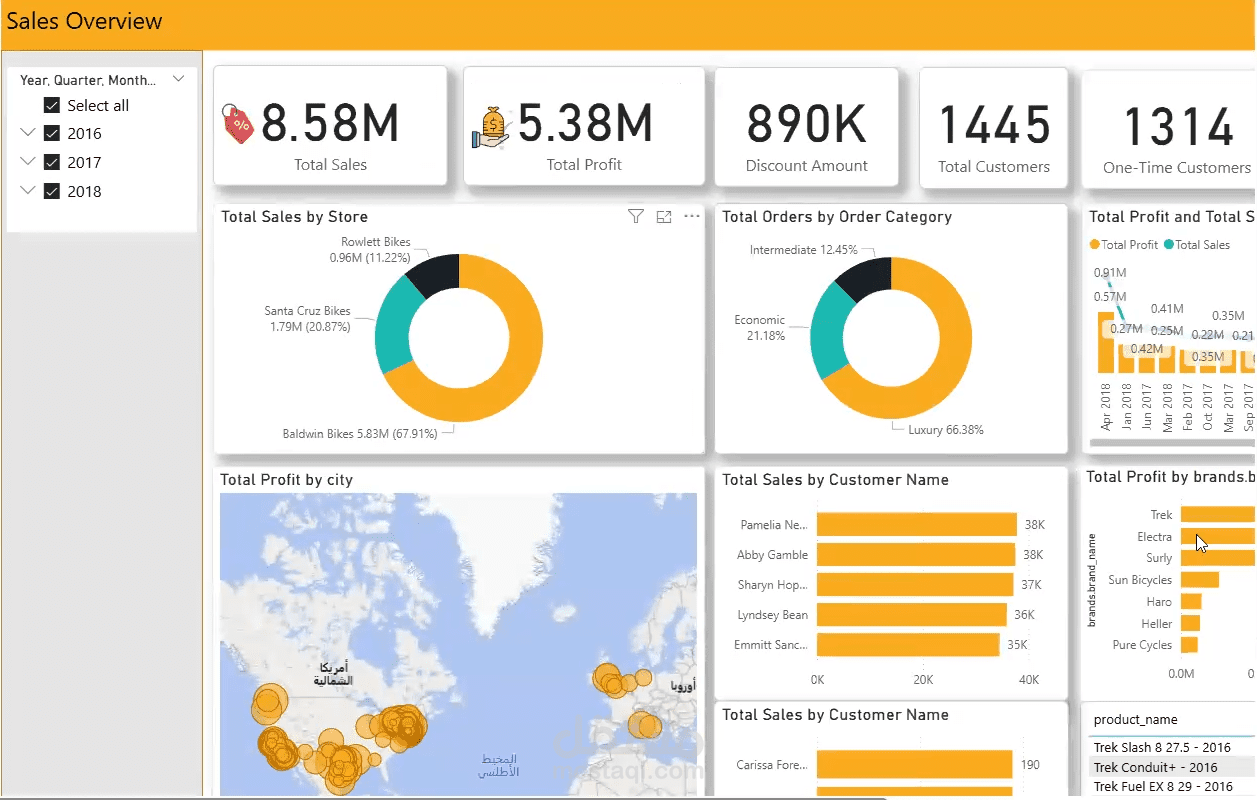

لوحة تفاعلية توضح مؤشرات الأداء الرئيسية للمبيعات (إجمالي المبيعات 8.58M، الأرباح 5.38M، العملاء 1445).
تُظهر الأداء حسب المتاجر والفئات والمنتجات، مع تحليل جغرافي للعملاء والأرباح. تساعد هذه اللوحة في تحديد المتاجر والعلامات التجارية الأكثر ربحية، وتتبع اتجاهات المبيعات، واكتشاف فرص تحسين الاحتفاظ بالعملاء.
This dashboard provides a comprehensive view of company sales performance across multiple dimensions. It highlights key metrics including total sales (8.58M), total profit (5.38M), discount amount (890K), and customer base (1445 customers, with 1314 being one-time buyers).
Store Performance: Baldwin Bikes generates the majority of sales (≈68%), followed by Santa Cruz Bikes (21%) and Rowlett Bikes (11%).
Order Categories: Luxury products dominate (66%), while Economic and Intermediate categories represent smaller shares.
Geographic Insights: Most profit is concentrated in North America with some sales in Europe.
Customer Analysis: Sales are driven by a few key customers, but retention is low as most are one-time buyers.
Brand Performance: Trek leads in profit contribution, followed by Electra and Surly.
Trends: Sales and profit trends over time help track growth and seasonal fluctuations.
Overall, the dashboard enables quick identification of top-performing stores, products, and customer segments, while also revealing opportunities for improving customer retention and diversifying sales categories.