supply chain
تفاصيل العمل
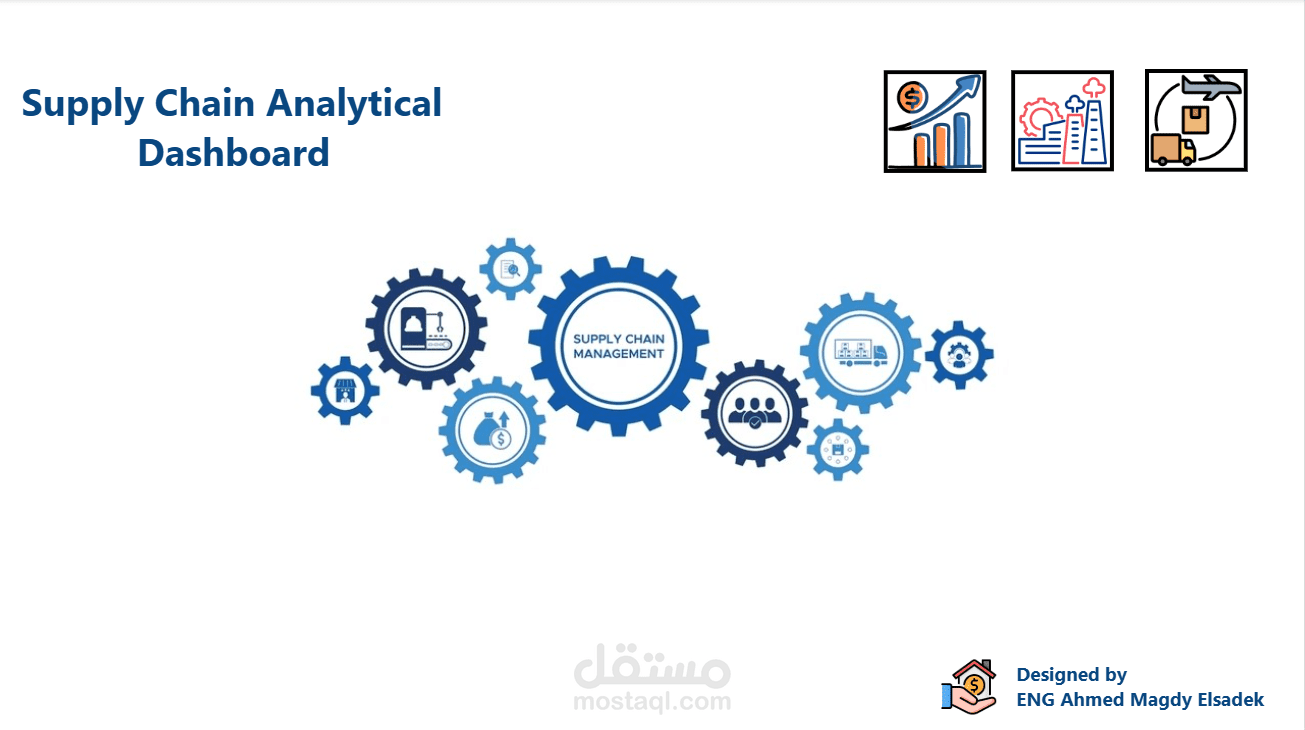
I designed an interactive Supply Chain Dashboard that visualizes the entire pipeline — from manufacturing to shipping and sales. Using Power BI, I transformed raw data into actionable insights through advanced metrics like revenue, cost analysis, product availability, inspection results, and profit by city. This project helps decision-makers track performance, reduce bottlenecks, and improve supply efficiency.


