Y2020 Performance Dashboard
تفاصيل العمل
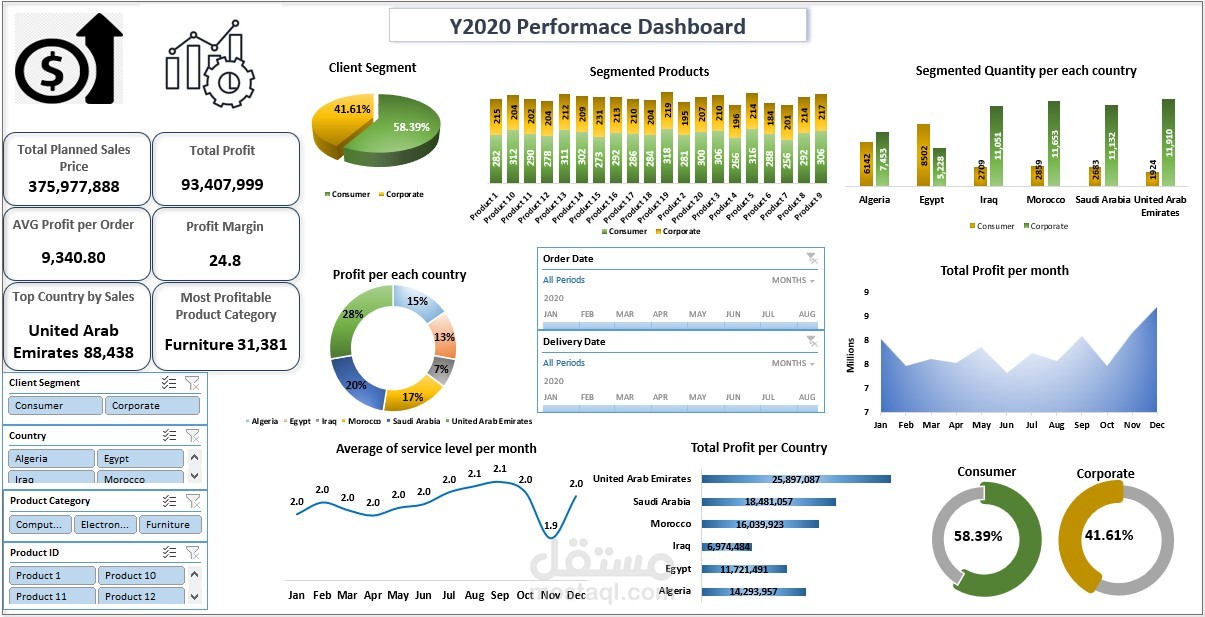
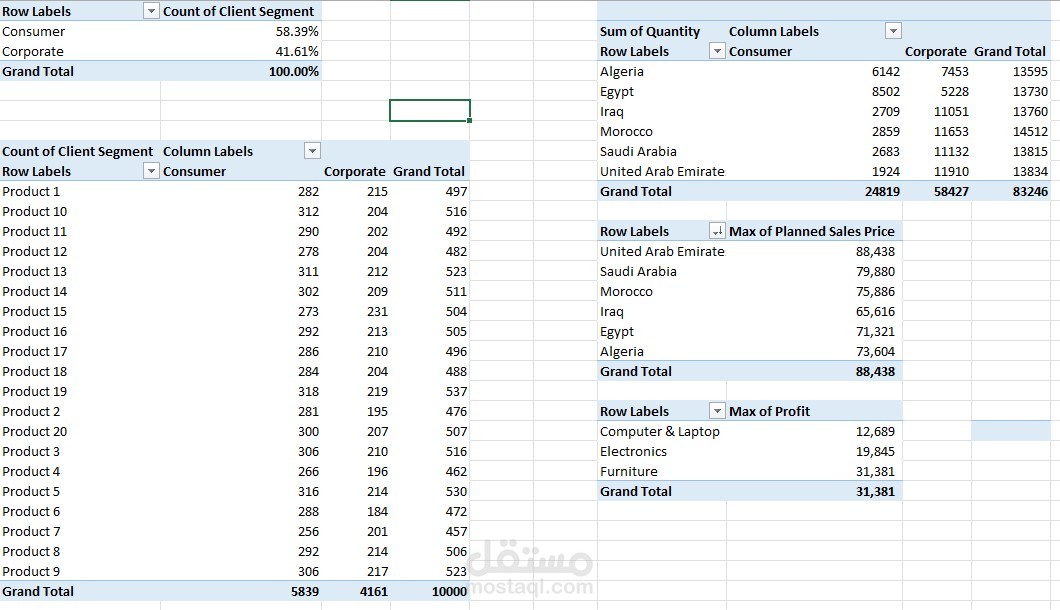
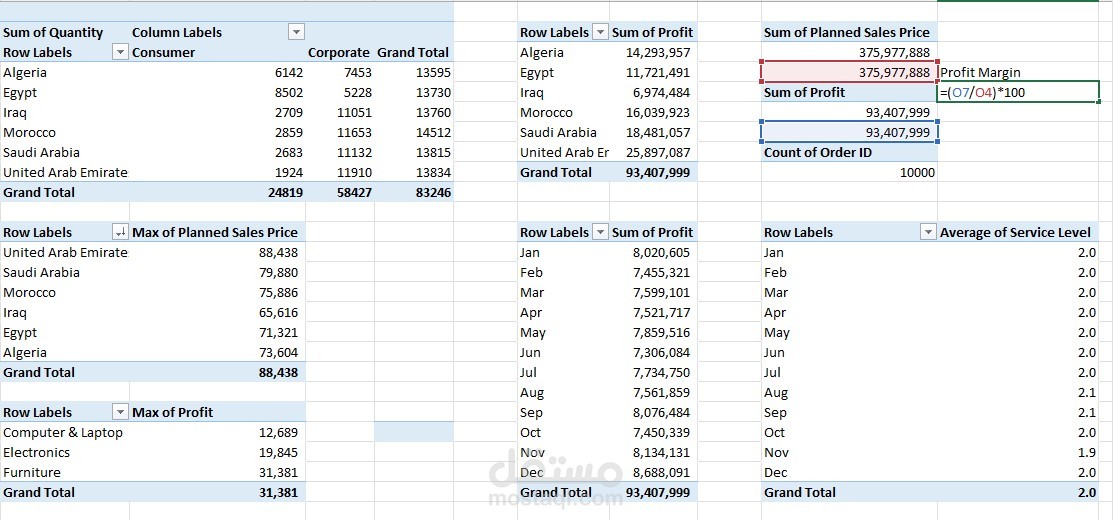
قمت بتطوير لوحات معلومات تفاعلية (Interactive Dashboards) باستخدام برنامج Excel، حيث أعمل على تنظيف وتجهيز البيانات ثم تصميم مؤشرات أساسية (KPIs/Cards) مثل إجمالي المبيعات، الأرباح، عدد الطلبات، والكميات المباعة، بالإضافة إلى إنشاء رسوم بيانية ومخططات ديناميكية (Pivot Charts & Graphs) توضح الأداء حسب الدولة، فئة المنتج، أو شريحة العملاء. يتم تنفيذ العمل بخطوات منظمة تبدأ من استلام البيانات، مرورًا بالتحليل، وصولًا إلى تصميم داشبورد احترافي وسهل الاستخدام يساعد على اتخاذ القرارات بشكل أسرع وأكثر دقة.
I develop Interactive Dashboards using Excel, where I clean and prepare the data, then design key performance indicators (KPIs/Cards) such as total sales, profit, number of orders, and quantities sold. In addition, I create dynamic charts and graphs (Pivot Charts & Graphs) that illustrate performance by country, product category, or customer segment. The work is carried out through an organized process that starts with receiving the data, followed by analysis, and ending with the design of a professional, user-friendly dashboard that helps in making decisions better and faster (Better & Faster Decision Making)