Sales Performance Dashboard for Retail Clothing Brand (Town Team)
تفاصيل العمل
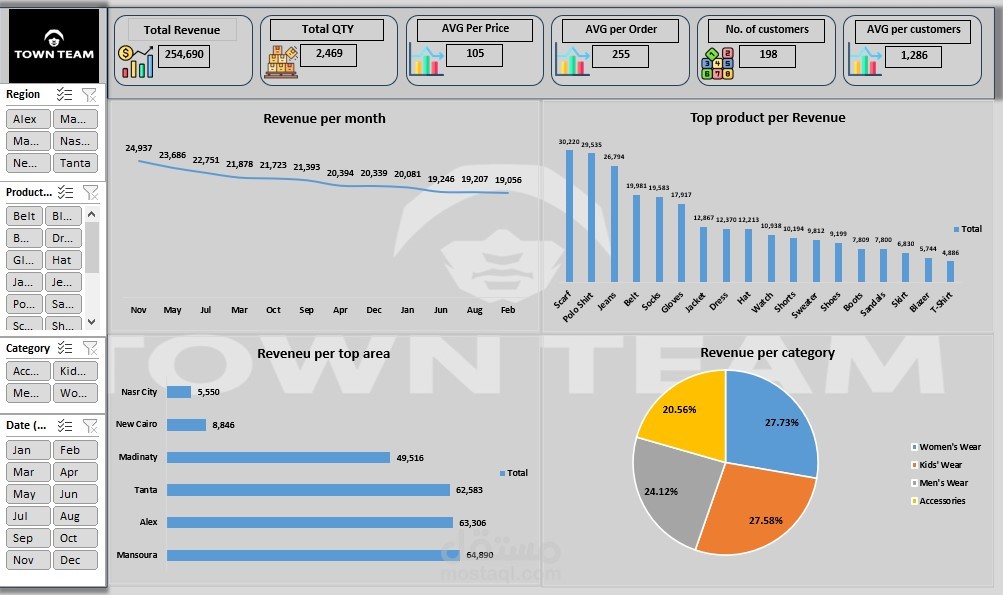
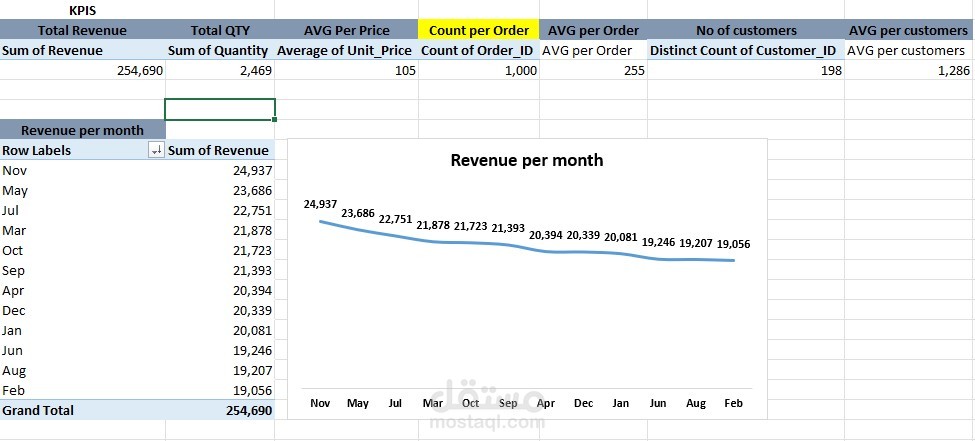
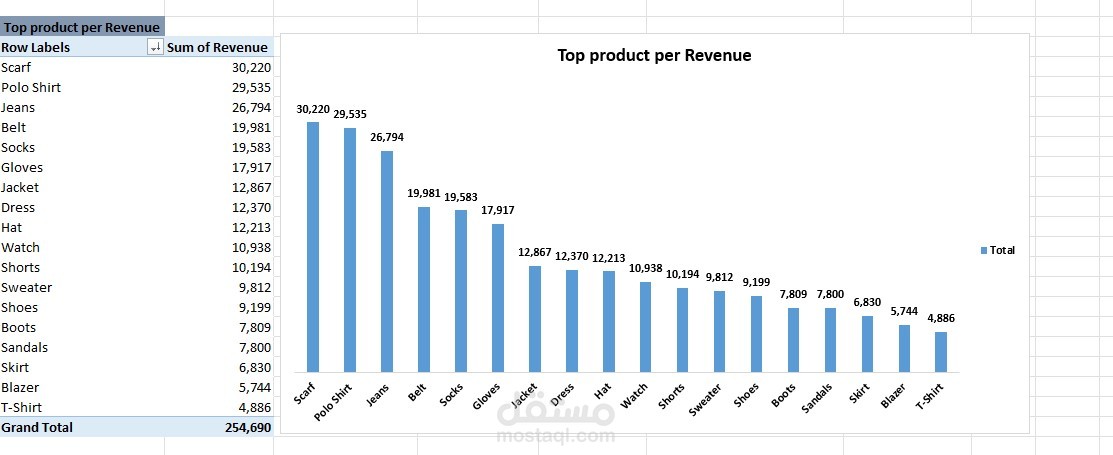
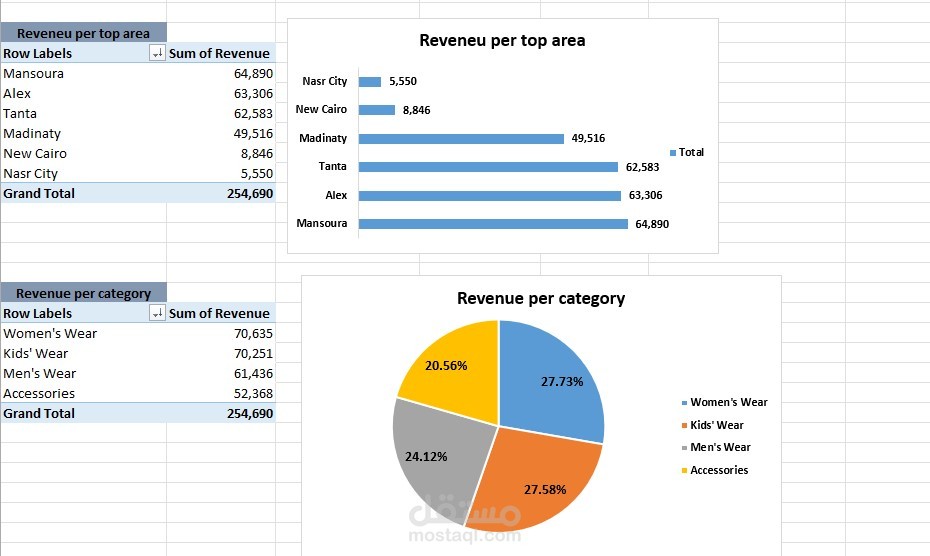
قمتُ بتنفيذ مشروع تحليل بيانات المبيعات وتصميم لوحة مؤشرات تفاعلية باستخدام برنامج Excel لصالح شركة Town Team المتخصصة في بيع الملابس بالتجزئة. الفكرة من العمل كانت تقديم أداة ذكية تساعد الإدارة على تتبع الأداء بسهولة من خلال مؤشرات رئيسية (KPIs) ورسوم بيانية ديناميكية توضح اتجاهات المبيعات وأفضل المنتجات والمناطق. اعتمدتُ في التنفيذ على خطوات منظمة تبدأ من تنظيف وتجهيز البيانات، مرورًا بإنشاء Pivot Tables & Charts، ثم تصميم لوحة مؤشرات واضحة وسهلة الاستخدام تتيح فلترة وتحليل النتائج بشكل فوري، مما يوفّر للإدارة رؤى دقيقة تدعم اتخاذ قرارات مبنية على البيانات.
I worked on a Sales Data Analysis and Interactive Dashboard project using Excel for Town Team, a retail clothing company. The purpose of the project was to provide management with a smart tool to easily track performance through KPIs and dynamic charts that highlight sales trends, top products, and regions. I followed a structured process starting with data cleaning and preparation, then building Pivot Tables & Charts, and finally designing a clear and user-friendly dashboard with interactive slicers and filters. This approach allowed management to gain accurate insights and make informed, data-driven decisions