Central Superstore – Power BI Dashboard
تفاصيل العمل
Central Superstore – Power BI Dashboard
Data Preparation
Imported the Central_Region dataset from the Superstore Excel file.
Cleaned the data by removing duplicates, handling missing values, and ensuring correct data types for dates, numbers, and text.
Created a new calculated column for shipping days (difference between order and ship dates).
Key Measures
To analyze business performance, several DAX measures were created, including:
Total Sales
Total Profit
Profit Margin %
Number of Orders
Number of Customers
Average Discount %
Average Ship Days
These measures were used across different visualizations to track sales and profitability performance.
Dashboard Visuals & Insights
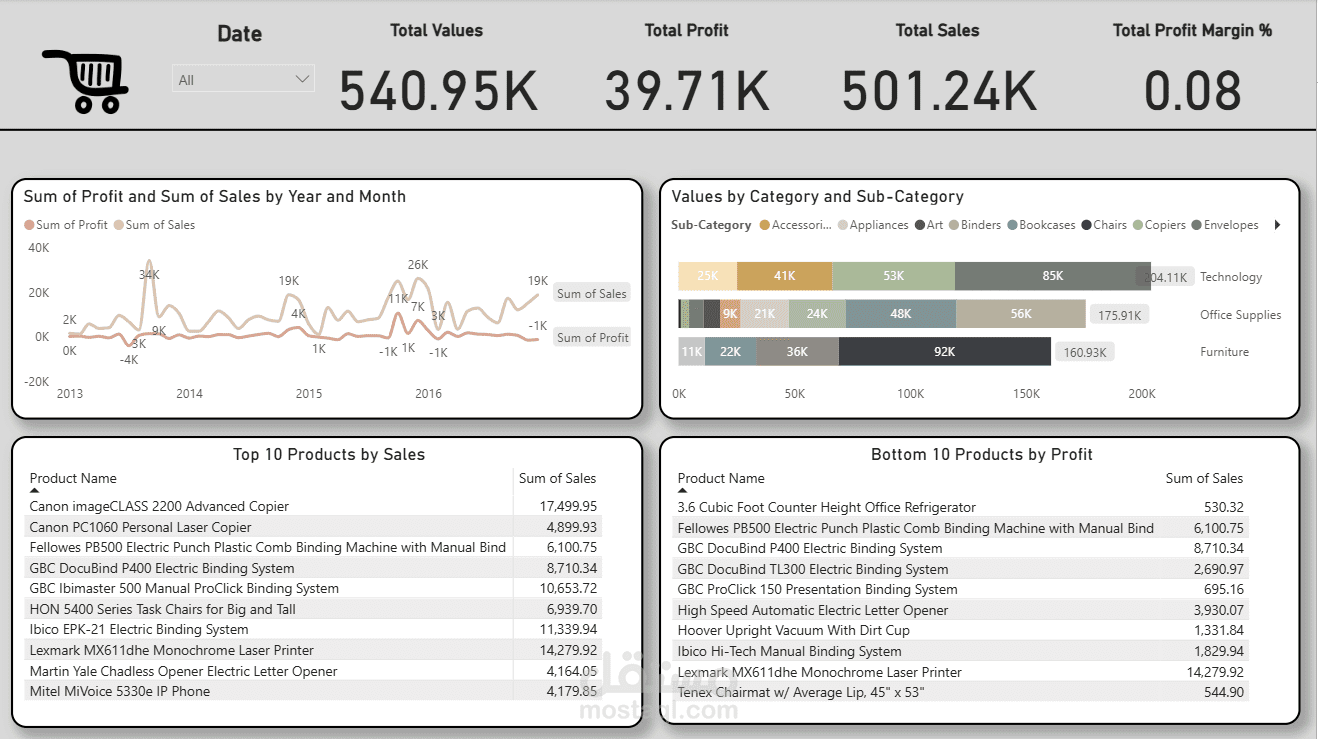
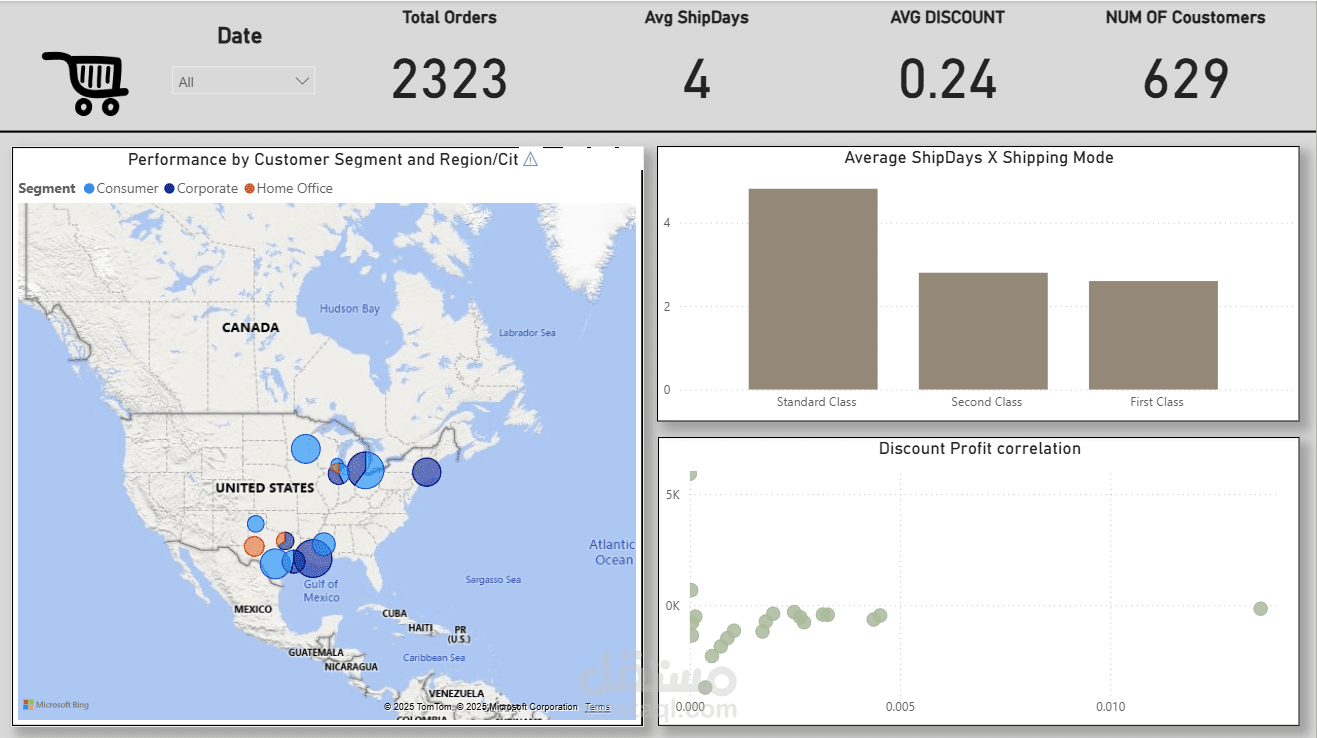
1. KPI Cards
Display key metrics such as Sales, Profit, Orders, Customers, Discounts, and Shipping performance.
Provides at-a-glance performance tracking for management.
2. Sales and Profit Over Time (Line Chart)
Shows the monthly trend of Sales vs Profit.
Highlights seasonal fluctuations and profitability variations.
3. Category & Sub-Category Analysis (Bar Chart)
Breaks down Sales across product categories (Furniture, Technology, Office Supplies).
Helps identify which areas generate the most revenue.
4. Top & Bottom Products (Tables)
Top 10 Products by Sales: showcases best-selling products.
Bottom Products by Profit: highlights items that may be unprofitable.
5. Customer Segmentation & Geography (Map)
Displays performance by Customer Segment and Region/City.
Helps identify where most customers and sales come from geographically.
6. Average Shipping Days by Ship Mode (Bar Chart)
Compares average delivery times for Standard, Second Class, and First Class.
Provides insights into shipping efficiency.
7. Discount vs Profit Correlation (Scatter Plot)
Plots discount percentage against profit.
General insight: higher discounts tend to be associated with lower or negative profits, indicating a trade-off between discounting and profitability.
Conclusion
This Power BI dashboard consolidates KPIs and visual insights into a single view. It allows decision-makers to:
Monitor financial performance.
Identify high-performing vs. underperforming products.
Understand customer and regional sales patterns.
Evaluate how discounts affect profitability.
Track shipping efficiency.