Pizza Place Sales Analysis – Power BI Dashboard
تفاصيل العمل
Pizza Place Sales Analysis – Power BI Dashboard
## Project Overview
This project analyzes sales data from a Pizza Place to identify insights related to revenue, customer behavior, and product performance. The dashboard was created in Power BI to provide an interactive and visual understanding of business performance.
## Objectives
* Track Total Sales, Total Revenue, Total Cost, and Profit.
* Identify sales trends across weekdays, weekends, and hours.
* Analyze best-selling pizzas and customer preferences.
* Provide actionable insights for improving business strategy.
## Dataset
* Source: Pizza Place dataset (CSV → imported into Power BI).
* Key Columns:
* order\_id – Unique order identifier
* order\_date – Date of purchase
* order\_time – Time of purchase
* pizza\_name, pizza\_size, pizza\_category
* quantity, price, total\_cost, revenue
## Dashboard Features
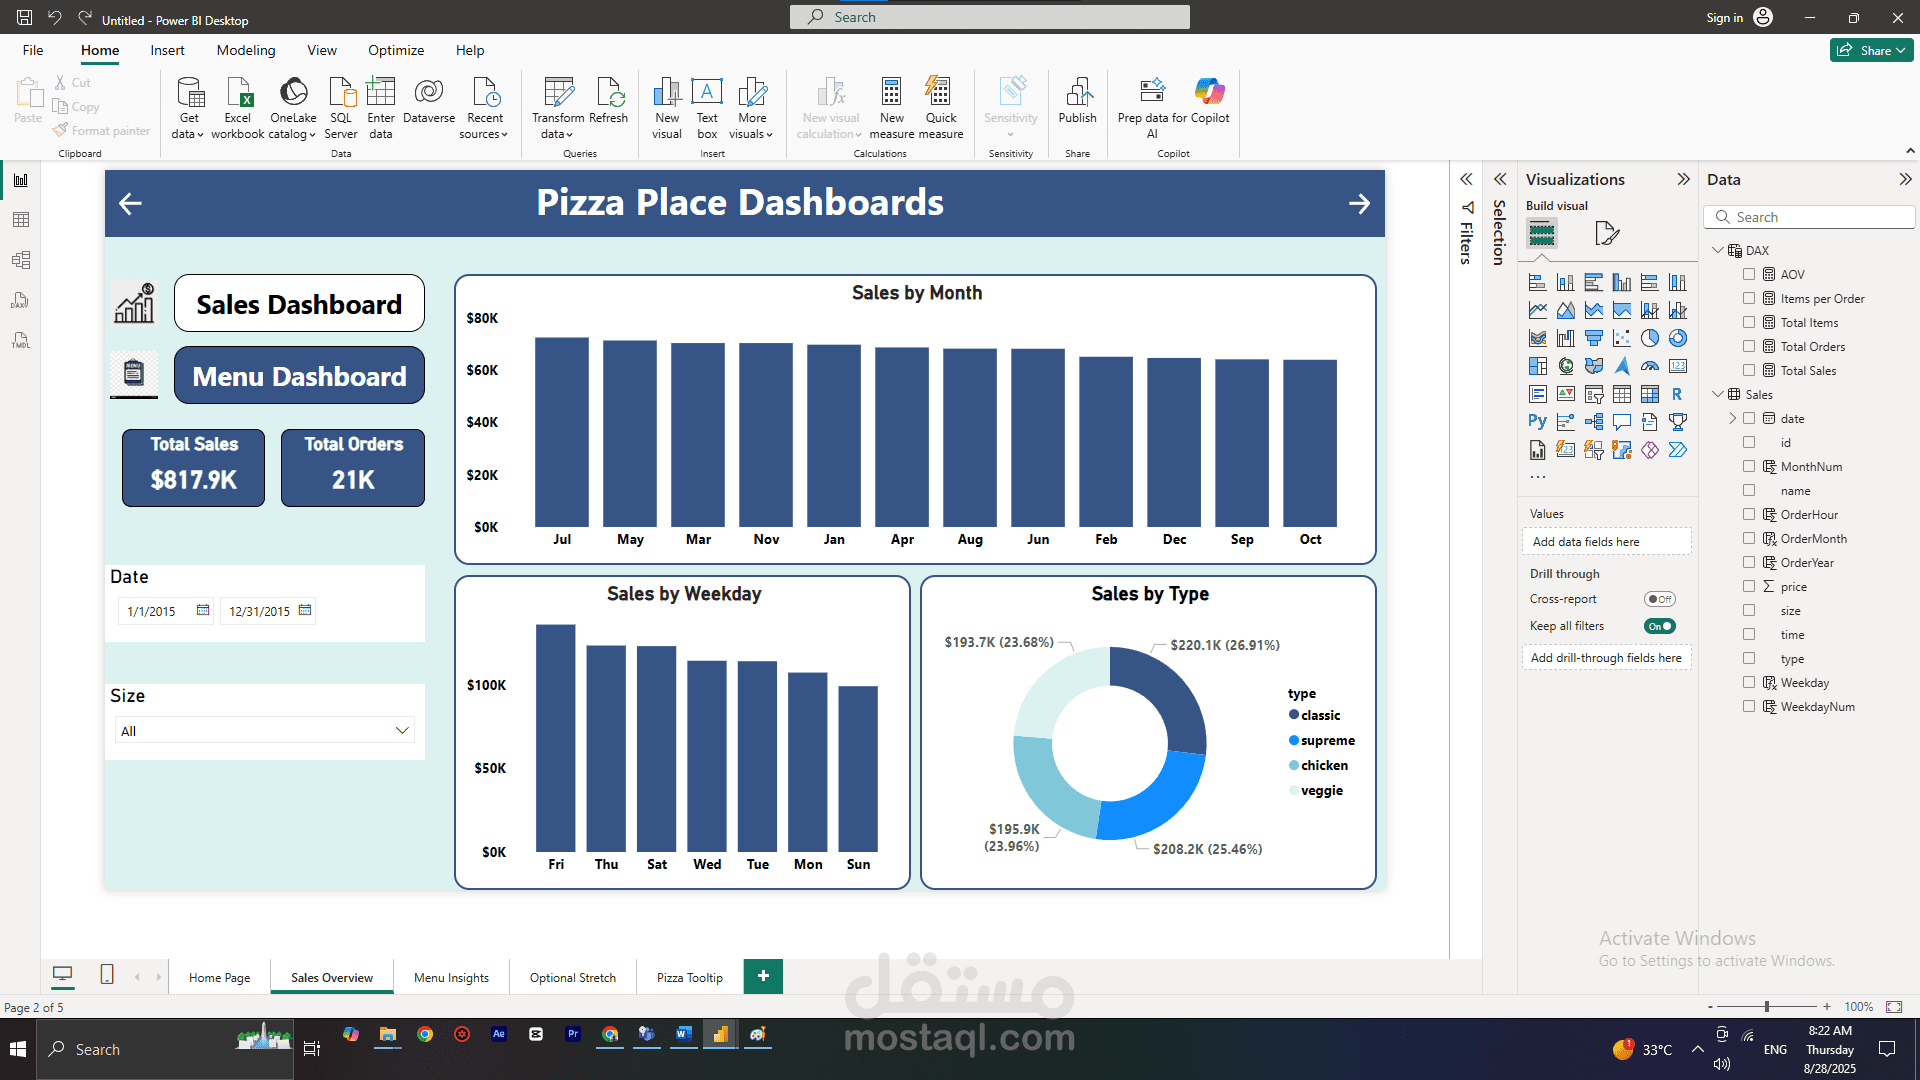
1. KPI Cards
* Total Sales, Total Revenue, Total Orders, Total Customers
2. Trend Analysis
* Sales and Profit by Month
* Weekday vs Weekend performance
* Hourly sales distribution (Peak hours)
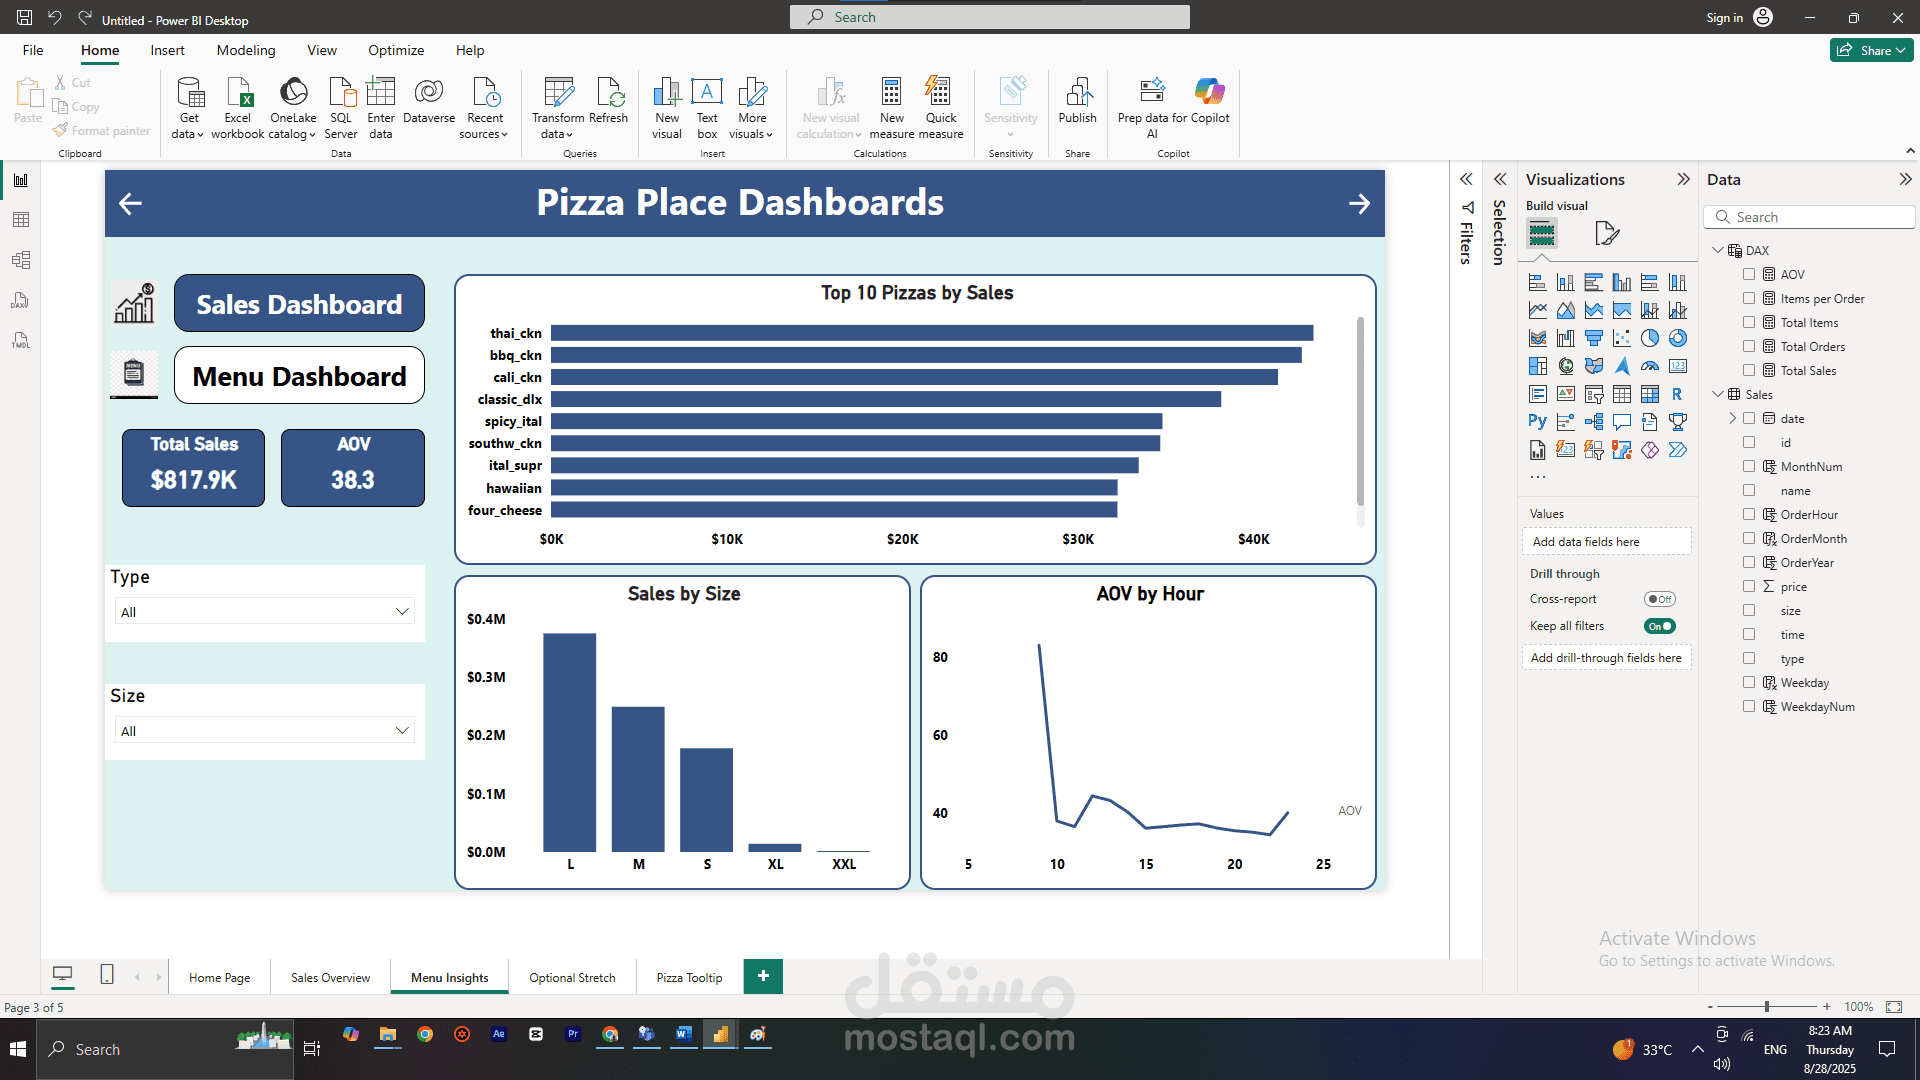
3. Pizza Performance
* Best and Worst selling pizzas
* Profit contribution by category and size
4. Interactive Features
* Slicers (by date, category, size)
* Tooltips with pizza details
* Navigation buttons (Home ↔ Insights)
## Insights
* Peak sales occur during weekends and evenings.
* Large-size pizzas contribute the most to revenue.
* A small percentage of pizzas generate the majority of profit (Pareto principle).
## Tools and Technologies
* Power BI (Data Modeling, DAX, Visualization)
* Power Query (Data Cleaning and Transformation)
## How to Use
1. Open the file `Pizza Place_abdelrahman mahmoud.pbix` in Power BI Desktop.
2. Use filters and slicers to interact with the dashboard.
3. Explore different pages for Overview and Insights.