Sales Dashboard – Town Team
تفاصيل العمل
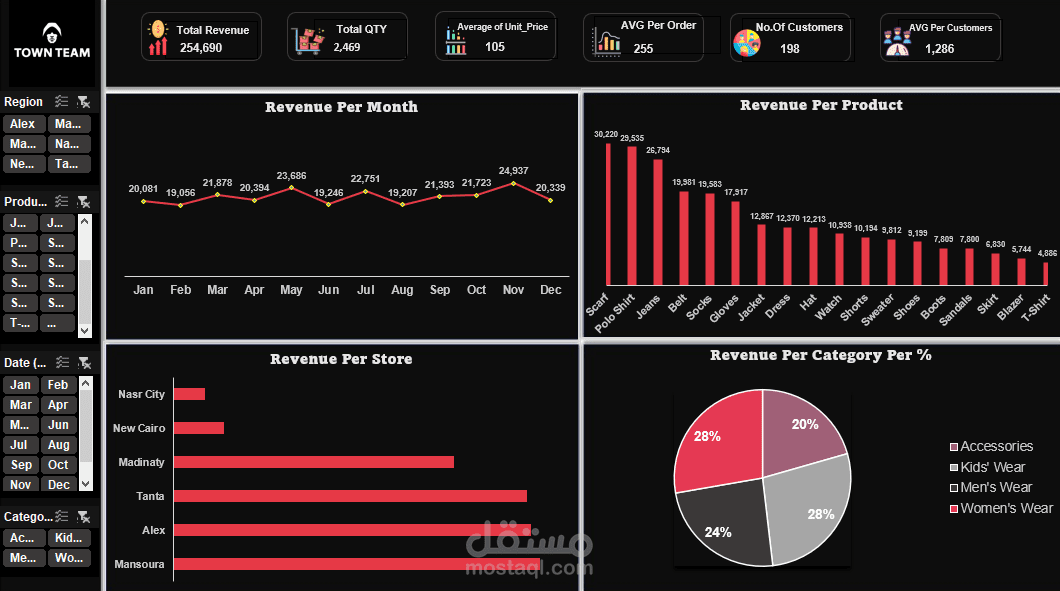
Problem: Sales data was scattered and
hard to interpret, making it difficult to
track store performance.
Solution: Designed and built an
interactive Excel dashboard using Pivot
Tables, Charts, and Conditional
Formatting to organize and visualize
sales data.
Impact: Enabled clear tracking of sales
trends, top-performing products, and
revenue insights, helping decision-making
for business performance