Sales Dashboard
تفاصيل العمل
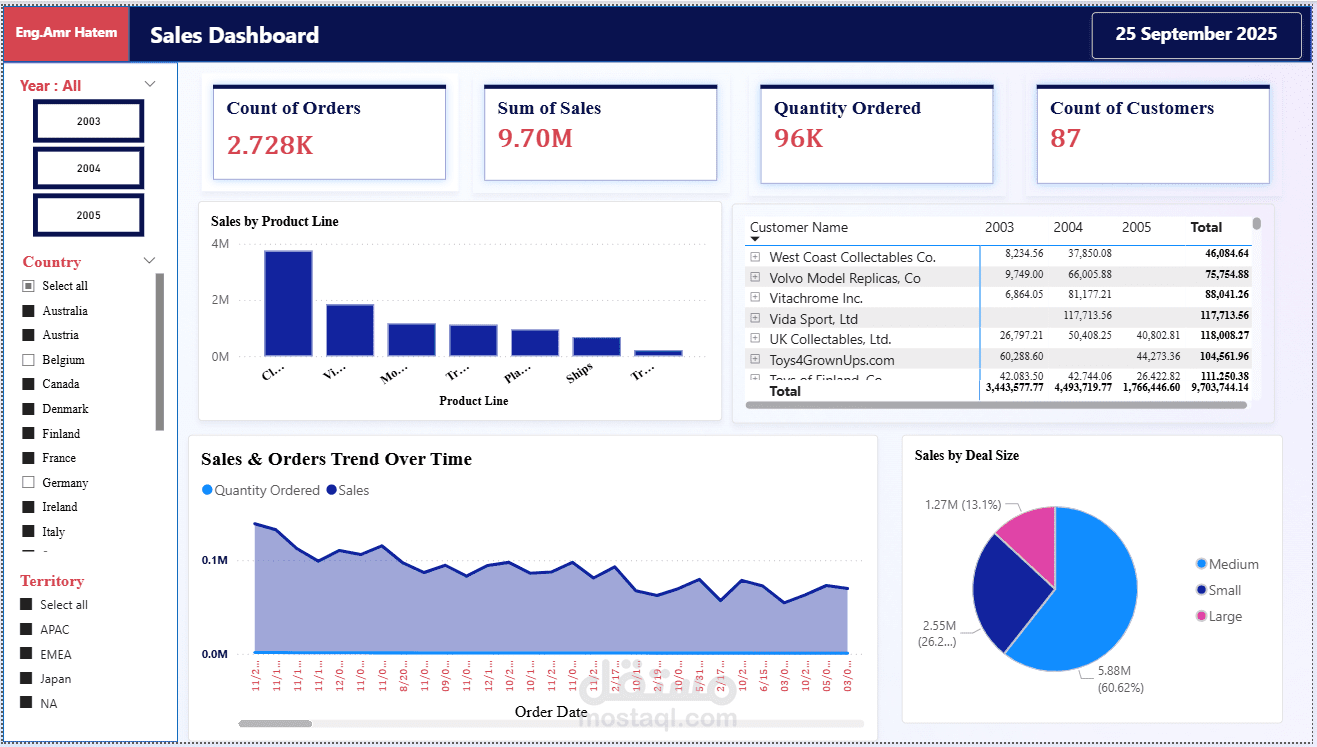
The dashboard was designed to provide a clear and structured view of key business metrics, and it includes the following components:
Summary KPIs: Total Sales, Orders, Customers, and Quantity Ordered
Sales Analysis: Performance by product line and customer segmentation
Time-Series Trends: Revenue and order volume over time
Deal Size Distribution: Visualization of business deal categories
Interactive Slicers: Filters for Year, Country, and Territory to enable dynamic analysis
This project has been a highly valuable learning experience, allowing me to strengthen my skills in data visualization, dashboard design, and the effective presentation of business insights. I focused on creating a professional layout with clean visuals and interactive elements to support data-driven decision-making.